



TinySharp Performance Diagnostics
Find what is slowing down WordPress with local, evidence-based performance diagnostics.

Use with caution
TinySharp Performance Diagnosti… works, but test it on a staging site before relying on it in 2026. Was last updated 1 month ago, and scores 60/100 on our health check.
- Tested with the latest WordPress (7.1)
- Small user base (<10 active installs)
- Very few reviews so far
How does it stack up?
Side-by-side on installs, updates, ratings & support


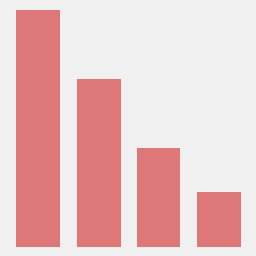
Daily downloads
Download spikes usually follow a new release — each site that auto-updates counts as a download.
Rankings
Where TinySharp Performance Diagn… stands todayWordPress.org search rankings
Live position in the plugin search, top 100| Keyword | Position |
|---|---|
| debug | >100 |
| performance | >100 |
| plugin performance | >100 |
| profiler | #31 |
| slow wordpress | >100 |
About TinySharp Performance Diagnostics
From the official readme · v1.0.0Description
TinySharp Performance Diagnostics is a read-only WordPress performance diagnostic plugin built around one simple question: what is actually taking time?
TinySharp Performance Diagnostics runs three local diagnostic requests against your homepage, WP Admin dashboard or a chosen same-site frontend URL and uses the median result. It measures server processing, database work, PHP memory, autoloaded options, outgoing HTTP requests, major WordPress lifecycle phases and directly timed callbacks on important hooks.
Measured evidence is translated into conservative plain-English next steps. Reports remain stored locally on the site.
The plugin does not create an account, send diagnostic reports to TinySharp or load remote code. During a scan, WordPress makes temporary loopback requests to the selected URL on the same website so the request can be measured.
Current features:
* Homepage, WP Admin and same-site Custom URL scan targets
* Separate local history for every target and Custom URL
* 3-run median diagnostic scan
* Performance health score
* Separate diagnostic coverage percentage
* Timed hook callback attribution
* Database caller attribution
* External HTTP caller attribution
* Top measured contributors from directly measured evidence
* Evidence-based Recommended next steps
* Request lifecycle timeline
* Memory usage relative to PHP memory_limit
* Autoloaded option size
* Last 10 scans stored locally and non-autoloaded
* Read-only normal scans; no plugin is globally disabled
TinySharp Performance Diagnostics separates measured work from conclusions. It does not recommend deleting or deactivating a plugin automatically.
Installation
- Upload the plugin ZIP in Plugins > Add New > Upload Plugin.
- Activate TinySharp Performance Diagnostics.
- Open Tools > TinySharp Performance Diagnostics.
- Click Run Performance Scan.
Frequently asked questions
Does the scan change plugin activation?
No. Scans observe the current request and do not activate, deactivate or omit plugins.
Do I have to scan every time I open the page?
No. The last 10 completed reports are saved locally. Your latest result opens automatically and you can run a new scan whenever you want.
Does scan history leave my website?
No. Scan history is stored locally in a non-autoloaded WordPress option.
What happens to saved data when I remove the plugin?
Deactivation keeps saved reports. Uninstalling and deleting TinySharp Performance Diagnostics removes its local scan history.
Does the plugin send telemetry or diagnostic data to TinySharp?
No. The plugin has no telemetry, account connection or TinySharp API request. Scan reports remain in the local WordPress database until they are cleared or the plugin is uninstalled.
Will TinySharp Performance Diagnostics tell me to delete a slow plugin?
No. A plugin may be doing important work. The action plan recommends investigation, configuration changes, retesting or alternatives where evidence supports it, but it does not automatically recommend deletion/deactivation.
Changelog
1.0.0
- Initial public release.
- Added homepage, authenticated WP Admin and same-site Custom URL diagnostics.
- Added three-run median reports, health score and diagnostic coverage.
- Added hook, database, HTTP, memory and autoload attribution.
- Added conservative evidence-based next steps and complete local-data cleanup on uninstall.
0.8.0
- Added translator context for every recommendation containing placeholders.
- Added ordered placeholders where translators may need to reorder numeric values.
- Documented intentional nonce-token, database, backtrace and filesystem profiler operations for code-quality checks.
- Removed development-only Markdown files from the production package.
0.7.0
- Hardened loopback requests so redirects are not followed beyond the selected target.
- Added complete temporary-token cleanup for failed and incomplete scans.
- Added safer authenticated WP Admin cookie handling.
- Added complete temporary-token and local-history cleanup.
- Removed placeholder release metadata and localized additional interface messages.
0.6.0
- Added Homepage, WP Admin and same-site Custom URL scan targets.
- Added same-site URL validation to block external scan targets.
- Added separate last-10 history for each scan target and Custom URL.
- Added target identity and URL to saved reports and history.
- Added timing coverage for major wp-admin hooks.
0.3.0
- Added local history for the last 10 completed scans.
- Latest report now appears automatically without rescanning.
- Added PHP/hook callback timing on major WordPress lifecycle hooks.
- Added callback-to-component attribution with confidence levels.
- Added Top measured contributors.
- Added Diagnostic Coverage separate from the performance score.
0.2.0
- Added 3-run median scans, database/HTTP attribution and request timeline.
Screenshots


For developers
Is this your plugin? Show off the numbers.
Add a live badge to your site, docs or GitHub README. It updates on its own — no account needed.
Best TinySharp Performance Diagnos… alternatives
All debug plugins →



FAQ
TinySharp Performance Diagnostics: quick answers
Straight answers, pulled from live WordPress.org data.
Live data from WordPress.org · checked Oct 10, 2026
Is TinySharp Performance Diagnosti… free?
Yes. TinySharp Performance Diagnosti… is free to download and use from the official WordPress.org plugin directory.
Is TinySharp Performance Diagnosti… safe to use in 2026?
TinySharp Performance Diagnosti… works, but test it on a staging site before relying on it in 2026. Was last updated 1 month ago, and scores 60/100 on our health check.
How many websites use TinySharp Performance Diagnosti…?
TinySharp Performance Diagnosti… is active on <10 WordPress websites and has been downloaded 139 times since it launched in September 2026. It was downloaded 75 times in the last 30 days.
Does TinySharp Performance Diagnosti… work with WordPress 7.1?
Yes. The developer has tested TinySharp Performance Diagnosti… up to WordPress 7.1.3, the latest release. It requires WordPress 6.4 or newer.
What PHP version does TinySharp Performance Diagnosti… need?
TinySharp Performance Diagnosti… requires PHP 7.4 or higher. Most hosts run PHP 8.x today, so it works on any modern WordPress hosting.
When was TinySharp Performance Diagnosti… last updated?
The latest version, 1.0.0, was released on September 3, 2026 (1 month ago).
Who makes TinySharp Performance Diagnosti…?
TinySharp Performance Diagnosti… is developed and maintained by TinySharp.
What are the best alternatives to TinySharp Performance Diagnosti…?
The most popular alternatives to TinySharp Performance Diagnosti… are WP Crontrol (300K+ installs), Query Monitor (200K+ installs) and Debug Bar (20K+ installs).
Powered by PageForge
Want thousands of pages that rank like these? Build them in an afternoon.
This directory runs on the same engine as PageForge. Turn any spreadsheet, CSV or API into thousands of fast, SEO-ready WordPress pages — with schema, internal links and AI-written copy baked in.
- CSV, Google Sheets & API data sources
- AI content, schema & internal links per page
- Works with Elementor, Gutenberg, Yoast & Rank Math
- Free on WordPress.org — no credit card