


Visualizer – Tables & Charts Manager with Built-in AI Generator
Create responsive charts and tables manually or let the built-in AI build them from a text prompt. Supports multiple chart types and flexible data.

Safe pick
Yes — Visualizer is a safe, well-maintained plugin to use in 2026. It runs on 20K+ sites, is rated 4.4/5 and was last updated 2 weeks ago, and scores 91/100 on our health check.
- Proven at scale on 20K+ active sites
- Actively developed — last update 2 weeks ago
- Tested with the latest WordPress (7.1)
Daily downloads
Download spikes usually follow a new release — each site that auto-updates counts as a download.
Rankings
Where Visualizer stands todayWordPress.org search rankings
Live position in the plugin search, top 100| Keyword | Position |
|---|---|
| ai-charts | #2 |
| charts | #2 |
| data visualization | #3 |
| datatable | #7 |
| tables | #10 |
Version adoption
Share of active sites per release.
Rating breakdown
★★★★★★★★★★ 4.4 from 225 reviews
About Visualizer
From the official readme · v4.0.8Description
Visualizer: Tables and Charts Manager for WordPress is a powerful and easy to use plugin used to create, manage and embed interactive, responsive charts & tables into your WordPress posts and pages.
The plugin leverages the Google Visualization API, DataTables.net, and ChartJS libraries to deliver responsive and animated charts, graphs, and tables, ensuring excellent cross-browser compatibility and a seamless mobile experience. It also comes with a built-in AI chart builder powered by D3.js that turns a plain text description into a publish-ready chart in seconds, no setup required. You can fully customize all aspects of the charts and tables to suit your needs. For enhanced data management features, including importing from Excel, CSV, Google Sheets, and more, consider exploring the PRO version.
🔗 HELPFUL LINKS
- Want to see Visualizer in action before installing? View Visualizer Demo [You can also try Live Preview button above]
- Need any help with setup? Check Documentation
- Don’t like reading? Check YouTube Playlist
- Interested in Visualizer Pro? Know more about Visualizer PRO
Why You’ll Love Visualizer
-
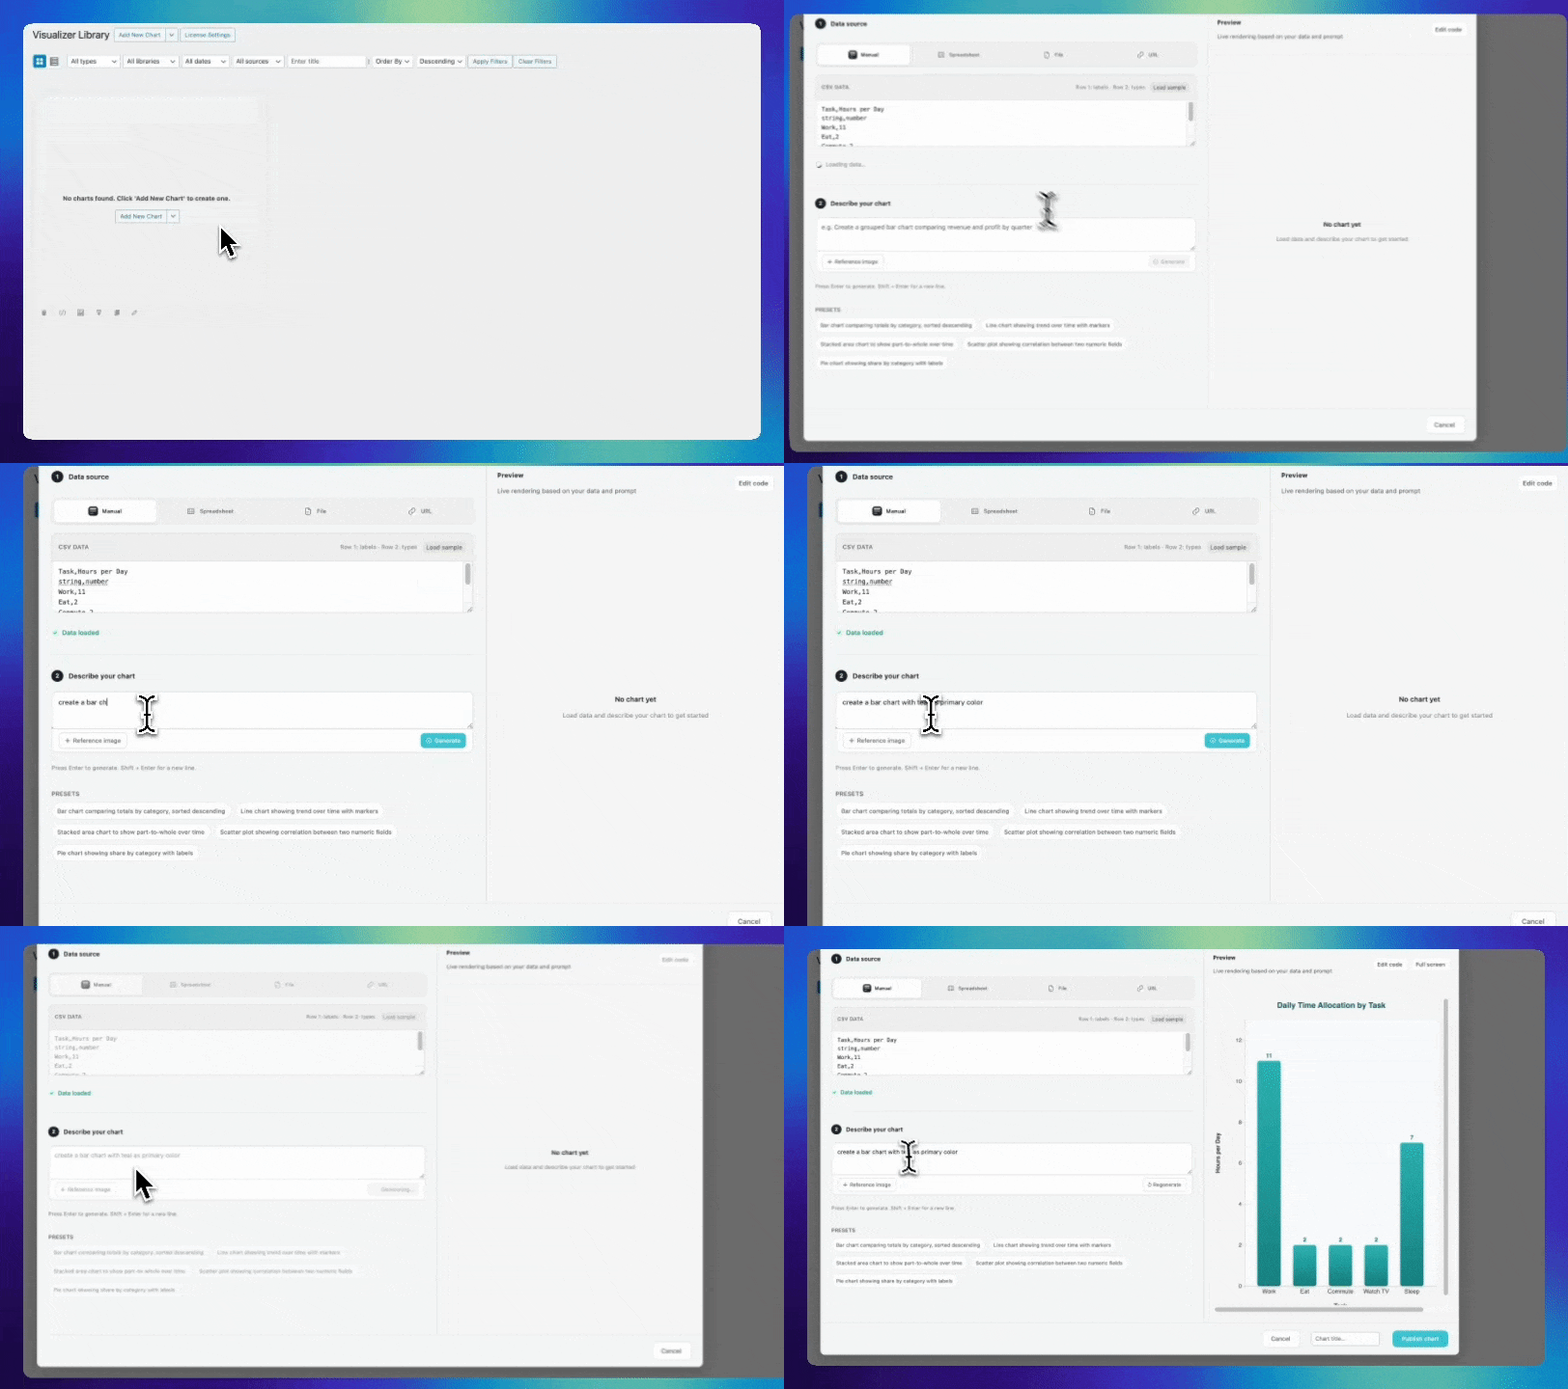
AI-Powered Chart Generation: Describe the chart you need in plain everyday language, and Visualizer AI builds it for you instantly. No API key, no setup, and no technical knowledge required. Whether you are a blogger, educator, or small business owner, you can go from a simple text prompt to a fully customizable, ready-to-embed chart in seconds, completely free.
-
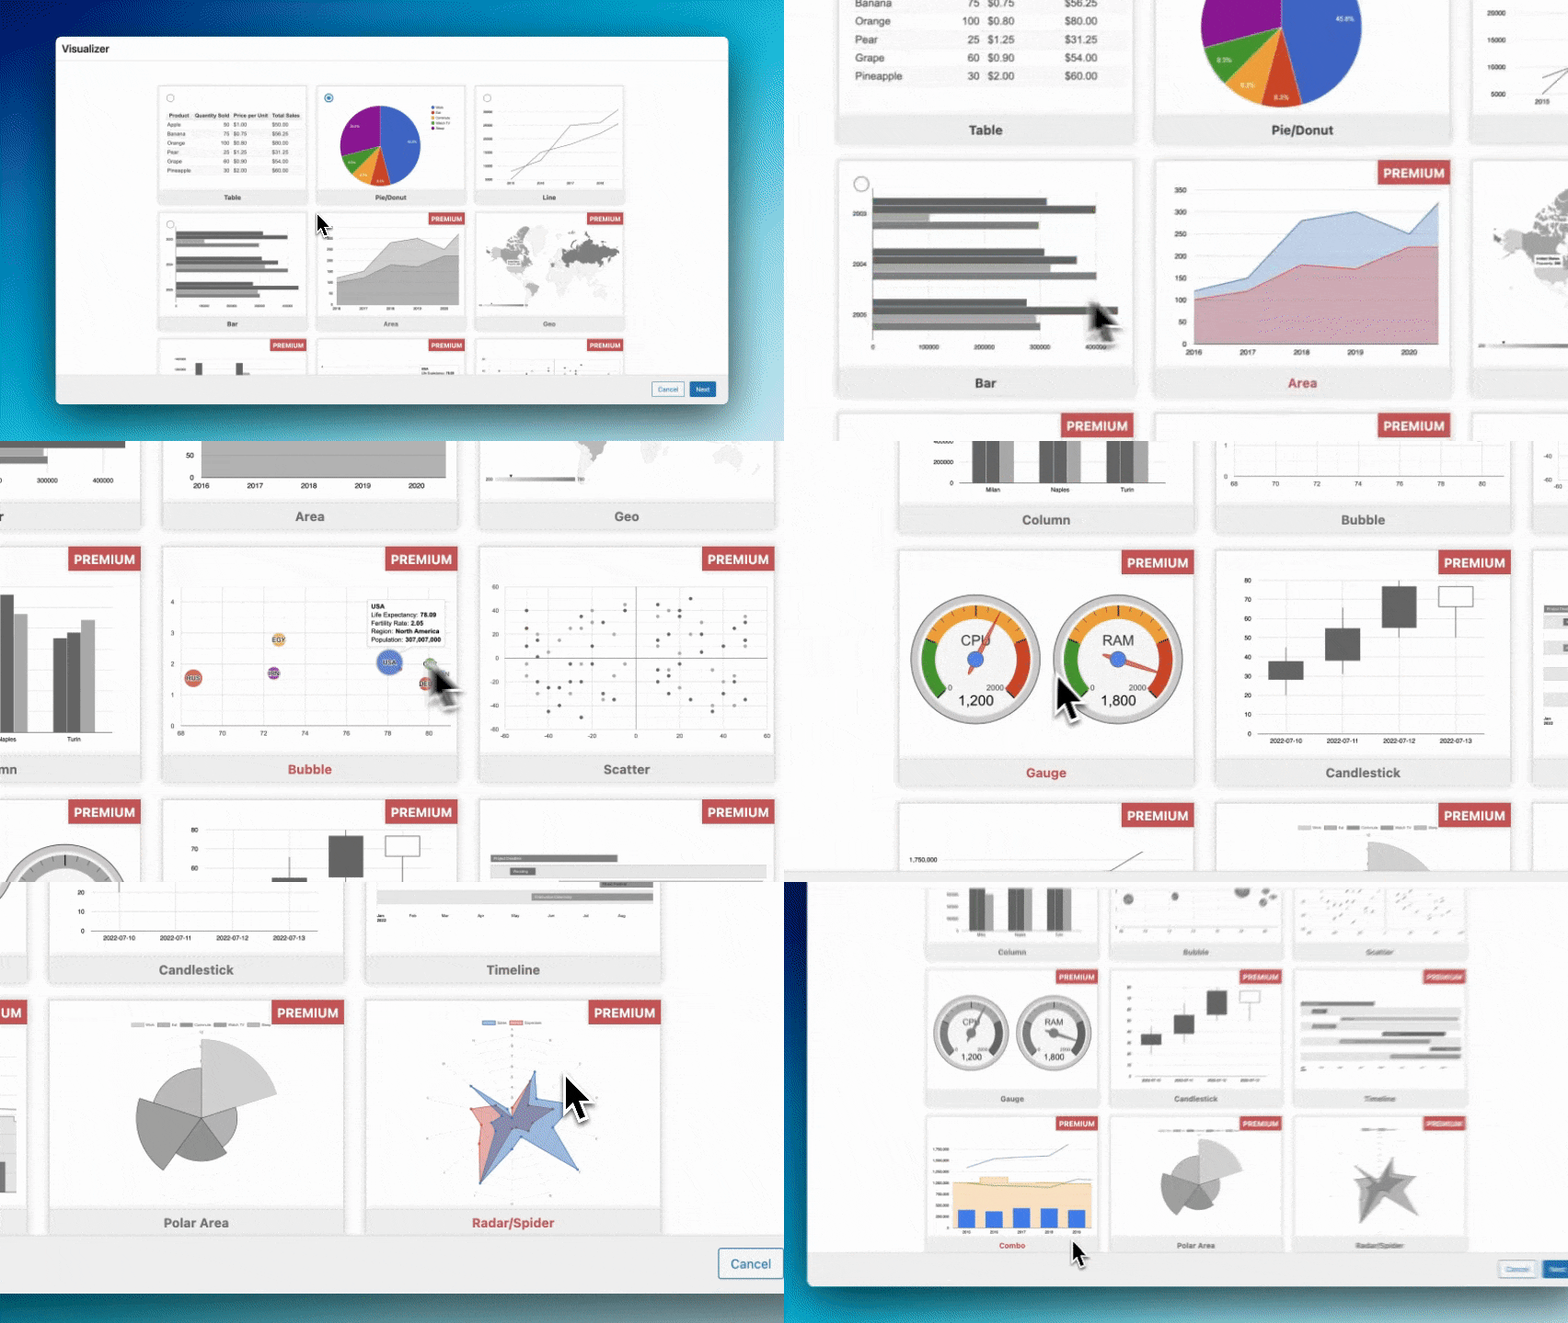
Diverse Chart Options: Begin with essential chart types like line, pie, bar, and table in the free version. Elevate your data presentation with advanced chart types such as scatter, area, and geo available in the Pro version. The free version offers a comprehensive range of options that are perfect for various visualization needs.
-
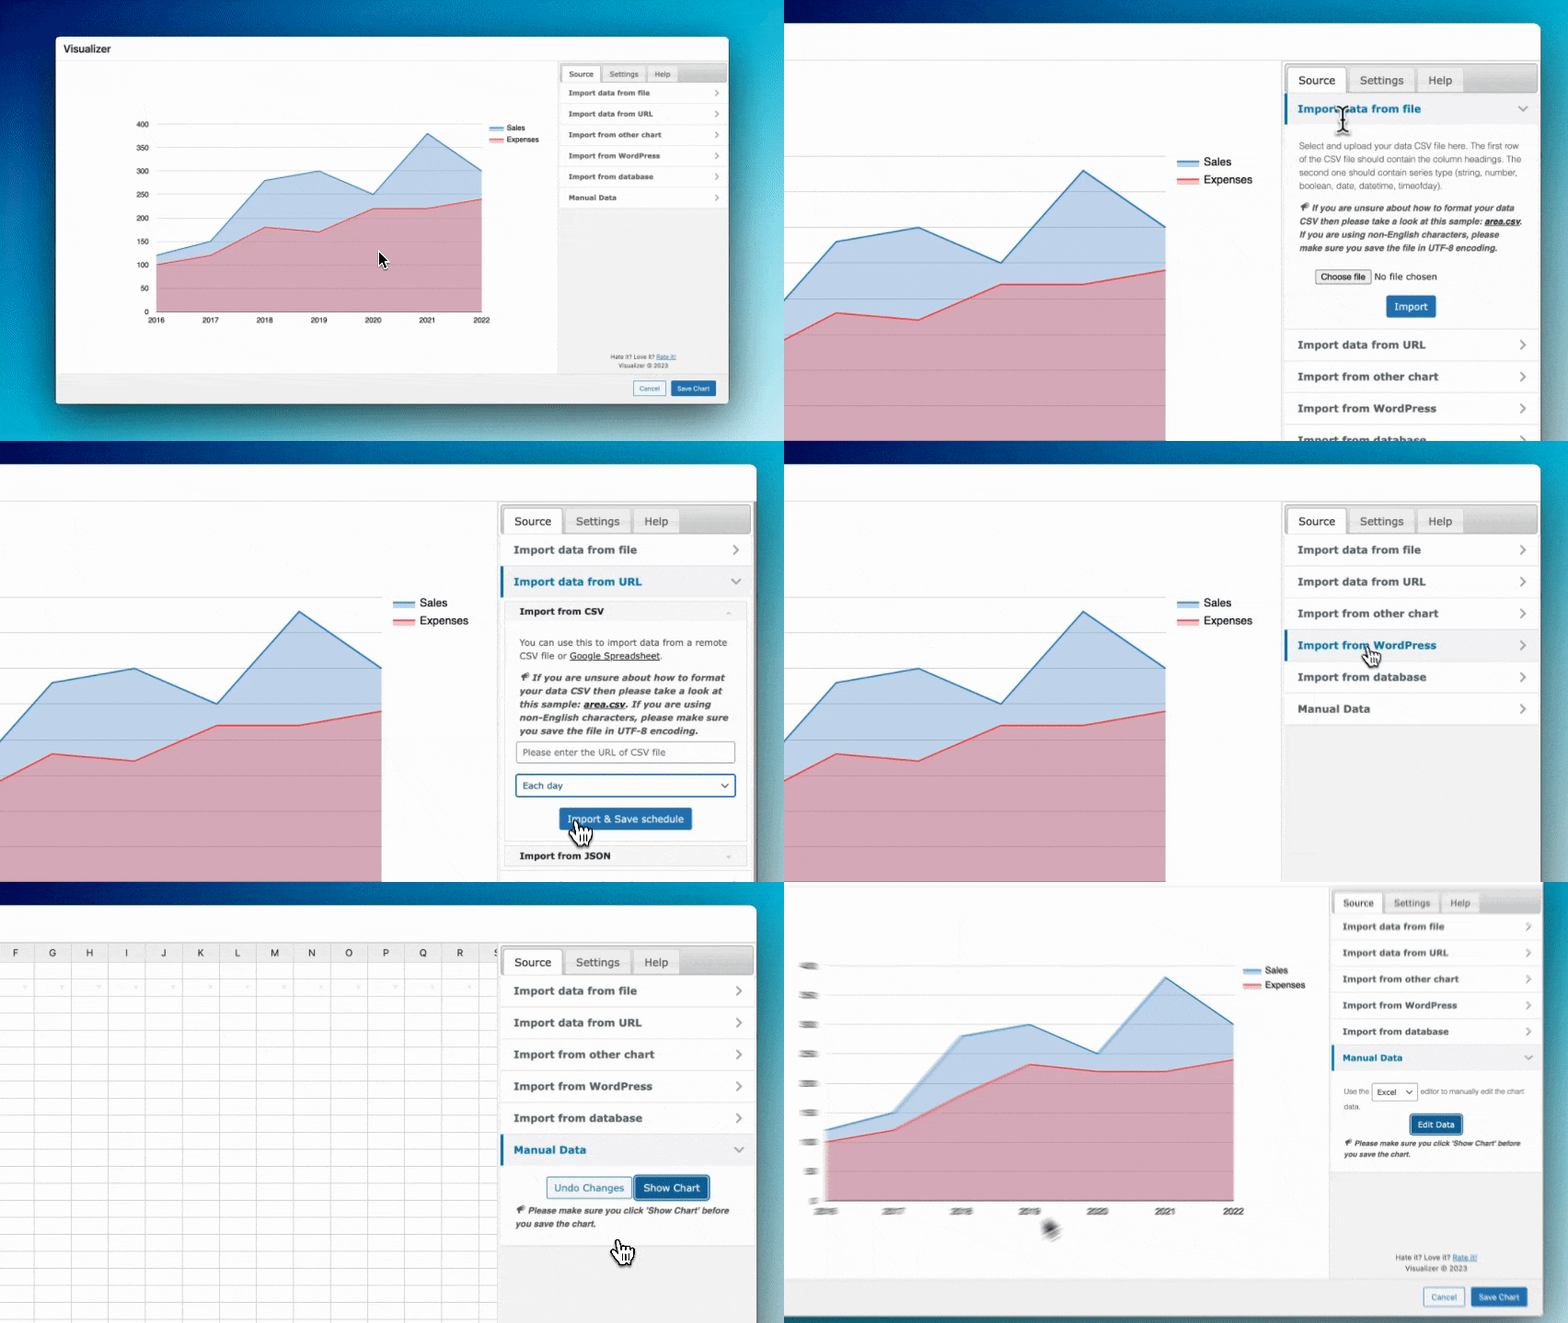
Manual Data Entry: Input data manually for quick visualization tasks. This method provides ultimate control over the content and structure of your charts, making it simple to tailor data presentation directly within the plugin interface.
-
Ultimate Responsiveness: Crafted using HTML5/SVG technology, Visualizer charts ensure flawless functionality across all devices. This commitment to responsiveness guarantees that your data is not only accessible but also optimally displayed on desktops, tablets, and smartphones, enhancing user interaction and engagement.
-
Data Table Capabilities: In addition to our responsive charts and graphs, you can also add responsive tables to your posts and pages and customize them to your liking. Visualizer Pro lets you enhance them with features such as sorting capabilities, pagination, and search functions. From pricing tables to product tables, the possibilities are vast and customizable to meet any data presentation need.
-
Seamless Integration and Compatibility: Whether you’re using the Gutenberg editor or other page builders, Visualizer integrates effortlessly into your WordPress environment. This seamless compatibility allows for straightforward chart insertion and management.
-
Flexible and Customizable: Make the charts and tables truly your own. Visualizer offers an extensive set of configuration options to perfectly match the look and feel of your website. Utilize Google Chart Tools with their default settings for simplicity, or dive into customization if your site’s style requires a unique approach. Every chart and table exposes numerous options that customize its appearance and functionality, ensuring your visualizations integrate seamlessly into your pages.
These versatile data handling capabilities ensure that Visualizer Free is equipped to meet a wide range of data visualization requirements right out of the box. Perfect for bloggers, educators, small businesses, and more, Visualizer helps you turn raw data into compelling, interactive charts that engage and inform your audience.
The above descriptions were partially taken from the Google Visualization API site
Build Charts Faster with Visualizer AI
Chart creation has always been the most time-consuming part of working with data. Picking the right chart type, entering values manually, and tweaking settings until it looks right. Visualizer AI changes that entirely.
Just describe what you want, and Visualizer builds it for you. Preview it live, refine it with follow-up prompts, and publish when it looks right. No coding, no configuration, and no API key required. It is available to all users, completely free, the moment you activate the plugin.
Here is what you can do with it:
📊 Turn a sales spreadsheet into a chart in seconds. Upload your data, type something like “create a bar chart showing monthly revenue by region,” and watch Visualizer build it live.
📋 Visualize survey results without the manual work. Got a CSV of responses? Upload it, describe the breakdown you want to see, and let AI handle the rest.
🎨 Match your brand without touching the settings. Mention your brand colors in your prompt, and Visualizer styles the chart accordingly, no manual color picking needed.
🖼️ Build from a reference image. See a chart style you like somewhere? Upload it as a reference, and Visualizer will use it as inspiration with your own data.
✨ YOU SHOULD USE VISUALIZER IF:
-
You Own a Personal or Small Business Website: You need a straightforward, powerful tool to enhance your website’s visual appeal with interactive charts and tables. Visualizer makes complex data understandable and engaging.
-
You Run an Educational or Financial Institution: For organizations that require regular reporting and data display, Visualizer offers comprehensive options for creating dynamic and informative charts and tables. This helps in better data analysis and presentation, aiding in decision-making and reporting.
-
You Aim to Enhance SEO and User Engagement: Using Visualizer’s interactive and responsive charts can significantly improve user engagement, keeping visitors on your site longer, which can positively impact your SEO rankings.
-
You are a Non-Profit Organizations: Non-profits can use Visualizer to display the impact of their initiatives through data. Create pie charts to show the distribution of spending or line charts to track donation trends over time, which can be powerful visuals for fundraising campaigns and annual reports.
-
You are Financial Advisors and Economists: Visualizer allows for detailed financial reporting and economic analyses with advanced chart types like candlestick and radar charts. These tools can be used to depict stock performances, economic cycles, or budget allocations, providing clients with clear insights into financial matters.
-
Regardless of Industry: With over 30,000 happy active users and 160+ 5-star ratings, Visualizer has been employed across a broad range of industries, including healthcare, marketing, education, and finance, demonstrating its versatility and effectiveness in any field.
Types of charts you can create with Visualizer: Visualizer WordPress graph and charts plugin provides a variety of charts that are optimized to address your WordPress data visualization needs. In the free version, it has line charts, bar charts, pie charts, table charts. These charts are based on pure HTML5/SVG technology (adopting VML for old IE versions), so no extra plugins are required. Adding these charts to your page can be done in a few simple steps.
- Table: Tables are extremely useful tools for displaying organized data. We use the datatable library to offer you endless customization options for any table needs you might have. Click here to see demo.
- Pie Chart: Pie charts are simple visualizations that allow you to easily illustrate the proportion of your data to your users. Click here to see demo.
- Line Chart: You can display a series of data points connected with line segments using the line chart. Click here to see demo.
- Bar Chart: You can show grouped data with bars proportional to the values they represent using the bar chart. Click here to see demo.
- Area Chart [PRO]: You can visually display quantitative data using the area chart. Click here to see demo.
- Geo Chart [PRO]: You can display a map of countries, continents, or regions with areas identified by the values you specify. Click here to see demo.
- Column Chart [PRO]: You can use a column chart to show comparisons among different categories. Click here to see demo.
- Bubble Chart [PRO]: A bubble chart is a type of chart that displays three dimensions of data. Bubble charts can be considered a variation of the scatter plot, where data points are replaced with bubbles. Click here to see demo.
- Scatter Chart [PRO]: You can display values in Cartesian coordinates using the scatter chart. Click here to see demo.
- Gauge Chart [PRO]: You can build different gauge charts to indicate metrics like speed, performance, progress, or similar measures. Click here to see demo.
- Candlestick Chart [PRO]: A candlestick chart is a style of financial chart used to describe price movements of a security, derivative, or currency. Click here to see demo.
- Timeline Chart [PRO]: You can group time-based values using the timeline chart. Click here to see demo.
- Combo Chart [PRO]: You can combine data series using different types of charts with the combo chart. Click here to see demo.
- Polar Area Chart [PRO]: Polar charts are data visualizations best used for displaying multivariate observations with an arbitrary number of variables in the form of a two-dimensional chart. Click here to see demo.
- Radar/Spider Chart [PRO]: A radar chart is a graphical method of displaying multivariate data in the form of a two-dimensional chart of three or more quantitative variables represented on axes starting from the same point. Click here to see demo.
🤝 ELEVATE YOUR DATA WITH VISUALIZER PREMIUM FEATURES
If you’re already benefiting from Visualizer, why not take your website to the next level with more powerful tools to enhance your data visualization capabilities and keep your audience engaged longer?
-
Advanced Data Synchronization: Automatically sync your data sources to ensure your charts are always current without manual input.
USE CASE: 🔍 Sarah, a market analyst, leverages Advanced Data Synchronization to streamline her workflow. She sets her data sources to auto-update, ensuring her market trend charts are always accurate, saving her hours each week and enhancing her reports’ credibility. -
Multi-Language Support: Automatically translate your charts and data presentations into multiple languages, broadening your audience reach.
USE CASE: 🌍 Elena, who manages a multilingual educational platform, uses Multi-Language Support to provide data visualizations in several languages, effectively increasing her site’s global usability and accessibility. -
Advanced User Permissions: Control who can view or edit your charts, perfect for teams needing to manage access at various levels.
USE CASE: 🛠️ Rachel, a project manager, configures user permissions to ensure that only relevant team members can edit financial forecasts, maintaining data integrity and security. -
Import Data from Files: Upload CSV files directly into Visualizer. This feature is ideal for those who prepare data in spreadsheet tools like Microsoft Excel or Google Sheets, allowing for quick and easy data visualization.
-
Import Data from Excel (XLSX): Upload Excel spreadsheets directly into Visualizer without any conversion steps. Simply export your workbook and import it as-is. Your column headers, values, and structure are automatically mapped to your chart or table, saving you time and eliminating formatting headaches.
-
Import Data from URLs: Keep your charts updated by importing data dynamically from external sources in CSV or JSON formats via URLs. This powerful feature is essential for displaying real-time or frequently updated data, reducing the need for manual updates.
-
Import from Other Charts: Seamlessly integrate data from other charts into new visualizations, facilitating easy data consolidation and comparison.
-
Import from WordPress: Directly pull data from your WordPress posts, pages, or custom post types to create dynamic charts that automatically update as your content changes.
USE CASE: ✍️ Benjamin, a digital marketing manager, uses this feature to track engagement across blog posts in real-time. He creates charts that update automatically with views and social shares, helping him quickly adjust content strategies based on what resonates with audiences. -
Import from Database: Connect directly to your database to fetch data, ensuring your visualizations reflect the most up-to-date information available.
-
Data Filter: Apply filters to your data within Visualizer, enabling viewers to interact with and explore data in a more focused manner.
USE CASE: 🕵️♂️ Tom, a market researcher, implements data filters on his demographic analysis charts, allowing users to select specific variables such as age and income, thereby drilling down into personalized data insights. -
Priority Support: Have access to our dedicated support team to help you resolve any technical issues swiftly, ensuring your visualizations are always performing optimally.
Unlock these premium features and more with Visualizer PRO!
Still have questions? Ask your pre-sales questions here, and we will get back to you promptly. Or, purchase with confidence and try it for yourself—we offer a 30-day no-questions-asked 100% money-back guarantee.
WE’RE HERE FOR YOU, AND WE TAKE ALL FEEDBACK SERIOUSLY
-
📚 Knowledge Base: We’ve created a complete documentation library and we’re still constantly updating with new tutorials.
-
📽️ Youtube Tutorials: Don’t like reading? We’ve created some YouTube tutorials to help you get started with the Visualizer plugin step by step.
-
🦸 Support Forum: We offer support to free version users here and try to reply within one business day.
-
🌟 Premium Support: We offer priority support for Plus license customers and live chat support for Infinite license customers.
If you have any feedback or feature suggestions for the Visualizer plugin, don’t hesitate to tell us. We read all feedback and ideas.
You’re in good hands
Visualizer is one of many great products by Themeisle. Join over 30,000+ Visualizer active users and half of a million Themeisle users from all over the world.
See what real users talk about us:
-
Visualizer is amazing! – “Just what I was looking for to make my information available and looks pleasing!”
-
Great Plugin for Bloggers – “It’s a great plugin for new bloggers like me. It’s working seamlessly on my website. I am using this plugin for the last couple of weeks and I am loving it.”
-
Works Well and Devs are Responsive – “We are using it on a rather complicated multisite install. After much research, we went with this plugin for our editors’ needs.”
-
The Best One I’ve Found – “After trying a couple of options, this was the one that worked the best.”
Installation
- Upload the files to the
/wp-content/plugins/visualizer/directory. - Activate the plugin through the ‘Plugins’ menu in WordPress.
Frequently asked questions
Shortcode does not turn into graph
Pay attention that to turn your shortcodes into graphs, your theme has to have call at the bottom of footer.php file.
Is there any documentation available for this plugin?
http://docs.themeisle.com/article/428-visualizer-charts-and-graphs-documentation
How to format chart series values?
http://docs.themeisle.com/article/672-how-to-format-series-values
How to create charts from your WordPress posts?
http://docs.themeisle.com/article/673-how-to-create-charts-from-your-wordpress-posts
How to automatically sync charts with online files?
http://docs.themeisle.com/article/674-how-to-automatically-sync-charts-with-online-files
How can I create/add a chart?
http://docs.themeisle.com/article/597-create-chart
How can I edit a chart?
http://docs.themeisle.com/article/602-how-can-i-edit-a-chart
How can I delete a chart?
http://docs.themeisle.com/article/600-delete-chart
How can I clone a chart?
http://docs.themeisle.com/article/598-clone-chart
How can I highlight a single bar?
http://docs.themeisle.com/article/603-how-can-i-highlight-a-single-bar
How can I populate chart series and data dynamically?
http://docs.themeisle.com/article/605-how-can-i-populate-chart-series-and-data-dynamically
How can I populate data from Google Spreadsheet?
http://docs.themeisle.com/article/607-how-can-i-populate-data-from-google-spreadsheet
How can I import content from another chart?
http://docs.themeisle.com/article/609-how-can-i-import-content-from-another-chart
How to export a chart?
http://docs.themeisle.com/article/608-how-to-export-a-chart
How can I edit the data manually?
http://docs.themeisle.com/article/610-how-can-i-edit-the-data-manually
How to enable frontend action buttons?
http://docs.themeisle.com/article/675-how-to-enable-frontend-action-buttons
How to use Google Visualization variables?
http://docs.themeisle.com/article/691-how-to-use-google-visualization-variables
How to report a security issue?
Plugin security is a core priority for us. If you identify a potential vulnerability, we ask that you disclose it responsibly. Please follow the reporting protocols outlined on our Security Page.
Changelog
Version 4.0.8 (2026-09-11)
- Fixed an error usage of a chart’s settings were stored as a string instead of an array.
- Update dependencies
- Fixed frontend chart failures when saved series settings are invalid.
- Fixed script execution from saved JSON chart credentials. Thanks Yaswanth Reddy Sunkara for the report.
- Updated dependencies
Version 4.0.7 (2026-07-30)
- Fixed charts using a database source saving the results of the previous query, so a saved chart no longer differs from the data shown in the editor.
- Updated dependencies
- Enhanced security — fixed unauthorized chart_data REST access.
Version 4.0.6 (2026-07-22)
- Fixed scheduled imports from remote CSV files so charts continue to refresh automatically in the background.
- Fixed an issue where charts using lazy rendering could remain blank when their scripts finished loading in the wrong order.
- Improved the overall security of the product. Thanks to creeper_kirby for responsibly reporting the issue.
- Updated dependencies.
Version 4.0.5 (2026-07-10)
- Enhanced security
Version 4.0.4 (2026-06-30)
- Enhanced security
Version 4.0.3 (2026-06-09)
- Improved layout compatibility with WP 7.0
Version 4.0.2 (2026-05-19)
- Fixed broken candlestick chart
- Updated dependencies
- Enhanced security (CVE-2026-65526 fixed)
Version 4.0.1 (2026-03-31)
- Internal update to ensure compatibility and improve system consistency.
Version 4.0.0 (2026-03-31)
New Features
- Introducing AI chart creation powered by D3.js
- You can now import XLSX files natively
- The charts library now includes a grid and list view for easier browsing
- Added a new Elementor widget for displaying Visualizer charts
- Improved auto-sync reliability by replacing WP-Cron with Action Scheduler
Improvements
- Cleaned up legacy block controls in the Block Editor
Bug Fixes
- Resolved an issue where lazy charts didn’t render when already in the viewport on page load
- Fixed a fatal error on servers with broken FTP filesystem configuration
- Addressed errors occurring in the getCSV method
- Fixed an intermittent sidebar scroll issue in Chrome
- Prevented a double clipboard alert when copying
- Fixed a bubble chart crash on window resize when using named series in manual configuration
Version 3.11.15 (2026-03-04)
- Enhanced security
Version 3.11.14 (2025-11-28)
- Enhanced security
Version 3.11.13 (2025-11-06)
- Enhanced security
Version 3.11.12 (2025-09-04)
- Updated dependencies
- Fixed issue with the number format not being applied properly to the last value of the Google chart
Version 3.11.11 (2025-05-27)
- Fixed chart rendering on page load with multiple charts
- Updated dependencies
Version 3.11.10 (2025-04-16)
- Fixed special characters not rendering correctly in Legend labels
- Updated dependencies
Version 3.11.9 (2025-02-13)
- Enhanced security
- Fixed extra column issue with a simple editor
Version 3.11.8 (2024-11-13)
- Updated WordPress core tested up to version
Version 3.11.7 (2024-11-07)
- Updated dependencies
- Enhanced security
Version 3.11.6 (2024-08-30)
- Fixed chart overlapping issue with the Gutenberg editor
Version 3.11.5 (2024-07-17)
- Updated promotional links and buttons
Version 3.11.4 (2024-07-09)
- Fixed broken link in the Map settings of the Geo Chart
- Fixed the default cron job sync time for data synchronization [PRO]
Version 3.11.3 (2024-05-27)
- Fixed the rendering of Visualizer widgets in the Customizer
Version 3.11.2 (2024-05-23)
- Fixed Visualizer block widget not loading
- Improved the popup rendering
- Enhanced security
Version 3.11.1 (2024-05-14)
- Fixed the permissions of the plans
Version 3.11.0 (2024-05-13)
Enhancements
- Added a manual data edit feature to the free version of the plugin
- Improved the flow of chart creation
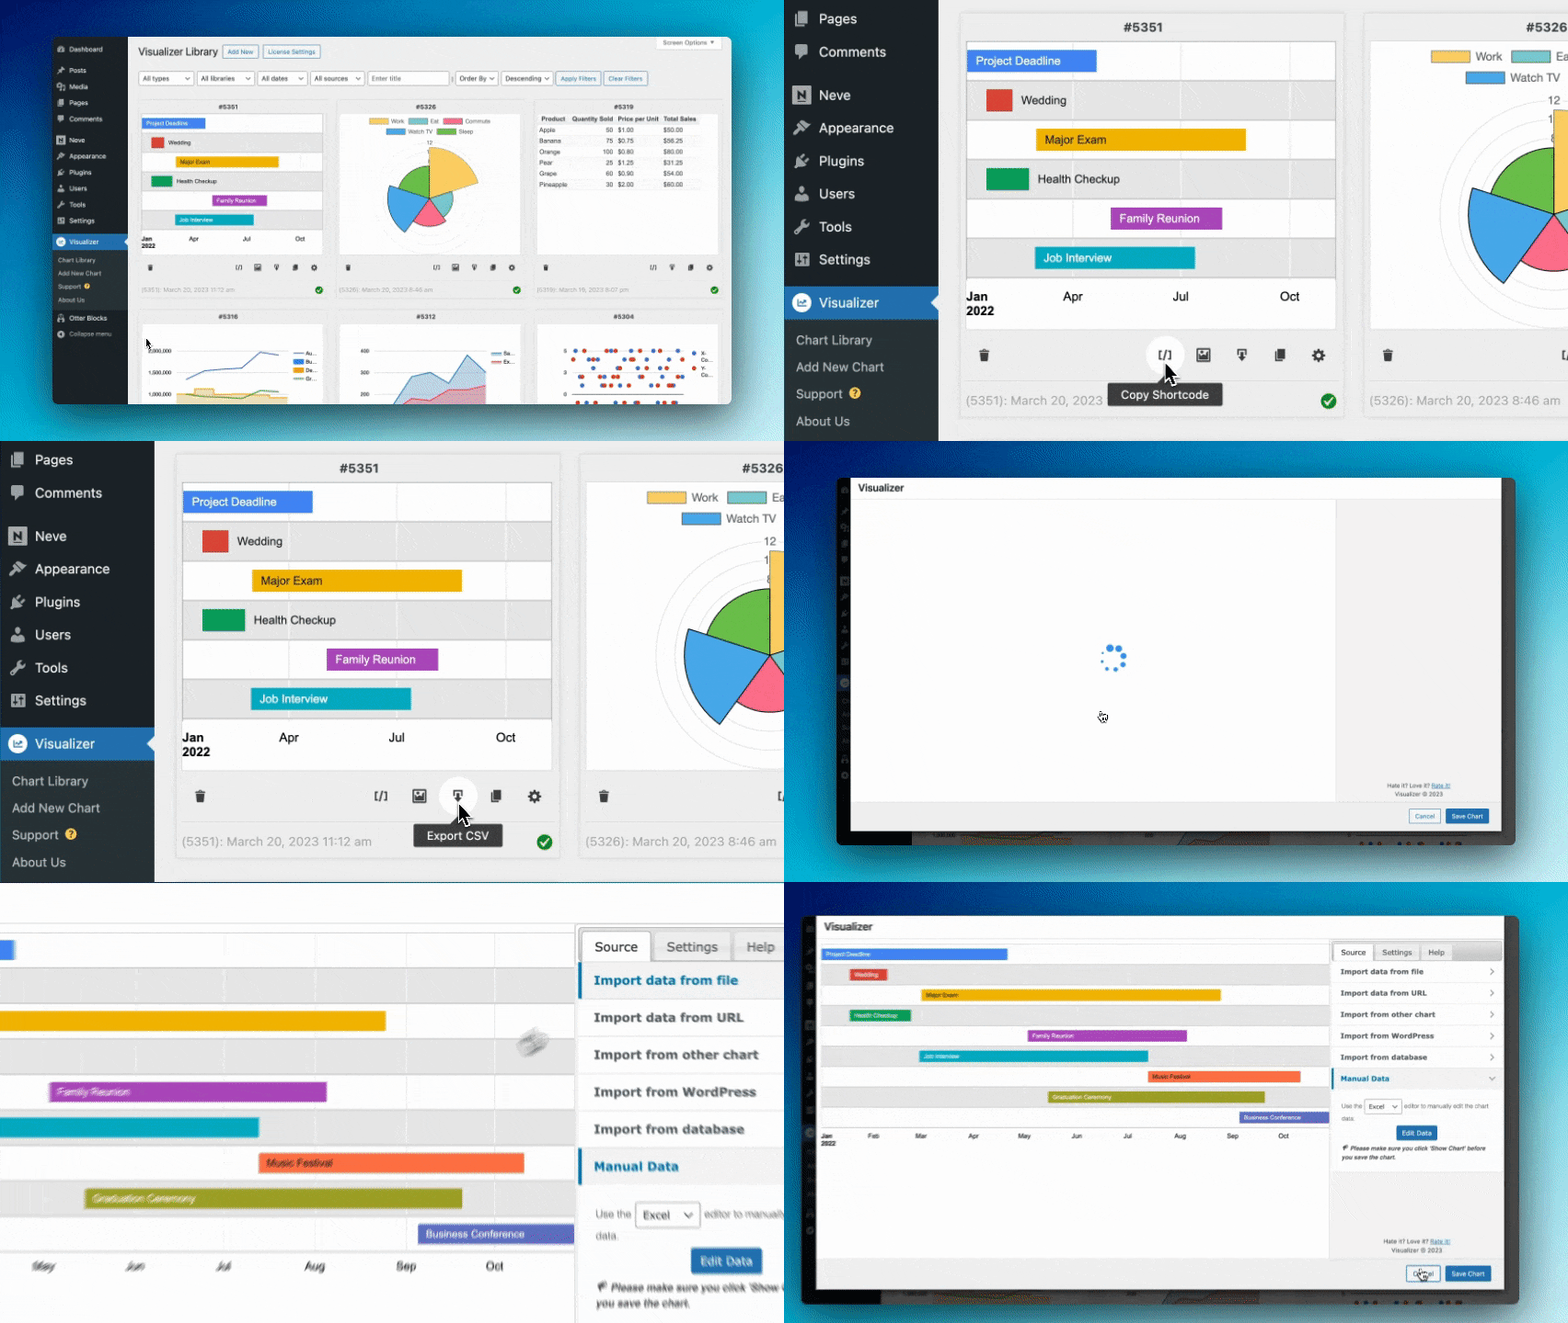
- Added a chart information panel: backend chart title & quick shortcode access
- Line and Pie charts from the ChartJS library are now available for free users, along with library selection and relative images
- Improved wording in onboarding
- Improved workflow for creating charts via the Visualizer Gutenberg block
- Moved chart library selection to the top of the page and showing charts from the available library only
- Unified chart edition (removed duplicated chart settings in block editor)
- Added optional feature usage data
- Enhanced security
- Improved the UI of the database query option (visible database prefix, sample query, autocompleting table names) [PRO]
Version 3.10.15 (2024-05-10)
- Updated internal dependencies
Version 3.10.14 (2024-05-10)
- Updated internal dependencies
Version 3.10.13 (2024-04-17)
Fixes
- Updated internal dependencies: Enhanced performance and security.
Version 3.10.12 (2024-04-15)
Fixes
- Updated internal dependencies: Enhanced performance and security.
Version 3.10.11 (2024-04-01)
Fixes
- Updated internal dependencies
- Improved E2E testing
Version 3.10.10 (2024-03-28)
Fixes
- Fixed blueprint schema for Live Preview
Version 3.10.9 (2024-03-27)
Fixes
- Visualizer live preview fixed
- Updated internal dependencies
Version 3.10.8 (2024-03-14)
Bug Fixes
- Fix Google chart rendering condition for Classic Plugin
- Changes the speed and position of the loading bar
Improvements
- Add a Live Preview button for the plugin page on wordpress.org
- Added NPS survey
Version 3.10.7 (2024-02-06)
Fixes
- Rendering charts that are under tabs/hidden containers
- Updated dependencies
- Updated CTA buttons
- Updated UTM campaign links
Version 3.10.6 (2024-01-18)
Fixes
- Enhanced security
Version 3.10.5 (2023-12-19)
Improvements
- Added chart responsive support
- SDK Updates
Bug Fixes
- Fixed chart data filter issue
- Fixed animation issue fusion builder
- Fixed live import issue with Gutenberg block
- Fixed tooltip text rendering issue in ChartJS
- Fixed onboarding chart import issue
- Removed PHP deprecated function
- Fixed compatibility issue with WP VIP
- Fixed PHP 8.1 deprecated error
Version 3.10.4 (2023-08-17)
- Updated dependencies
- Updated WordPress version required to 5.2 or higher
Version 3.10.3 (2023-06-13)
- Removed branding label
Version 3.10.2 (2023-06-05)
- Added About Us page integration
- Updated dependencies
Version 3.10.1 (2023-05-24)
- Fixed data tables horizontal scrolling issue
- Added legend position default label text
- Added tooltip default label text
- Fixed Gutenberg block error
- Fixed table chart rendering issue in Gutenberg block
- Fixed compatibility issue with the FSE editor
- Fixed compatibility issue with WP 5.6
- Fixed console error when importing charts from others
- Fixed pagination enable/disable issue
- Fixed editor rows limitation issue
Version 3.10.0 (2023-04-04)
- Added a setup wizard onboarding page
- Fixed empty chart issue
Version 3.9.7 (2023-03-30)
- Improved chart actions icons
- Updated WordPress core tested up to version
Version 3.9.6 (2023-03-20)
- Fixed custom format issue in ChartJS
Version 3.9.5 (2023-01-30)
- Improved security by escaping shortcode attribute before render
- Compatibility with PHP 8.2
Version 3.9.4 (2023-01-12)
- Fixed the lock of PRO features bypass
Version 3.9.3 (2023-01-05)
- Fixed the chart refresh problem when importing from CSV #970
Version 3.9.2 (2022-12-21)
- Fixed Geo chart [PRO] flickering issue
- Added disable legend option for ChartJS chart
- Enhanced security
Version 3.9.1 (2022-11-17)
- Fixed PHP error when Polylang plugin is activated #960
Version 3.9.0 (2022-11-10)
- Fixed table chart decimal number issue Decimal Numbers are ignored and not displayed #955
- Fix the scrollbar issue that happens on WP 6.1 version [WP 6.1] Chart permissions selector is not scrollable #950
- Fix PHP Warning Warning when copy (frontend action) is enabled #949
- Compatibility with the WPML translation plugin for translating charts [PRO feature] add support for string translations #731
- Integration with Woocommerce Data endpoints for creating charts [PRO feature]
- Show new features on chart library page
Version 3.8.1 (2022-10-12)
- Change copy shortcode icon to clone a chart We can change copy Short Code icon #945
- Fix temp file creation issue on instawp selecting the line chart is not working on instawp #940
- Fix control Type error
- Fixed simple editor scrolling issue
- Fix filter broken layout
- Fix chartJs javascript error when rendering multiple charts
Version 3.8.0 (2022-09-21)
- Add data filter support for the charts
Version 3.7.12 (2022-09-07)
- Fixed compatibility issue with some themes and plugins #933
Version 3.7.11 (2022-08-30)
- Fix update axis baseline color #925
- Update more features images #926
- Fix update minor grid line field #924
- Add new filter for container attributes #922
- Fix axis data format issue #920
- Chart unique title #915
- Fix block back button issue #930
- Userguide broken documentation link #918
Version 3.7.10 (2022-07-05)
- Fix watermark/copyright opacity wrong value #910
Version 3.7.9 (2022-06-22)
- Fix branding bad HTML
Version 3.7.8 (2022-06-21)
- Add the description field in the pie chart
- Fix Label other is not visible on the pie chart
- Fix the pagination issue in the chart library
- Update dependencies
Version 3.7.7 (2022-05-31)
- Harden security by enforcing escaped urls.
Version 3.7.6 (2022-05-26)
- Fix PHP 8.0 or above compatibility issue
- Fix the space missing between the id and class attributes of the charts
- Fix compatibility issue with Ultimate Coupons for WooCommerce Free plugin
- Fix charts placed in accordion (tabs) that do not load properly
- Fix conflict with translation plugins
Version 3.7.5 (2022-03-17)
- Fix display long hAxis text issue
- Improve features discoverability.
Version 3.7.4 (2022-02-07)
- Fix multiple lazy load charts issue
- Tested up to WordPress 5.9 version
Version 3.7.3 (2022-01-19)
- Fix multiple charts lazy rendering issue
- Upgrade jQuery UI core library CDN
- Fix console error when rendering multiple charts
- Keep only Line / Pie / bar / Table charts in free version
Version 3.7.2 (2021-12-20)
- Add latest chartJS library support in the bar chart
- Fix horizontal axis showing date format in Bar chart
- Fix orientation rotate issue in mobile
- CSS performance improvements
- Improve JS performance
Version 3.7.1 (2021-11-17)
- [Feat] Allow charts to render in dashboard areas via 3rd party plugins like Dashboard Widgets Suite
- [Fix] Changing Line Chart series style to dot on some series changes the order of tooltip information
- [Fix] Problem with X-Axis of Line chart on Safari if date/datetime is used as values
- [Fix] Multiple Visualizer charts causing rendering issues (blank page)
- [Fix] Charts are not resizing on landscape view on mobile
- [Fix] Notices/Warnings appear on the front-end if the user is not logged in for some charts
- [Fix] Radar/Spider Chart Tooltip in PRO does not show the data value
Screenshots
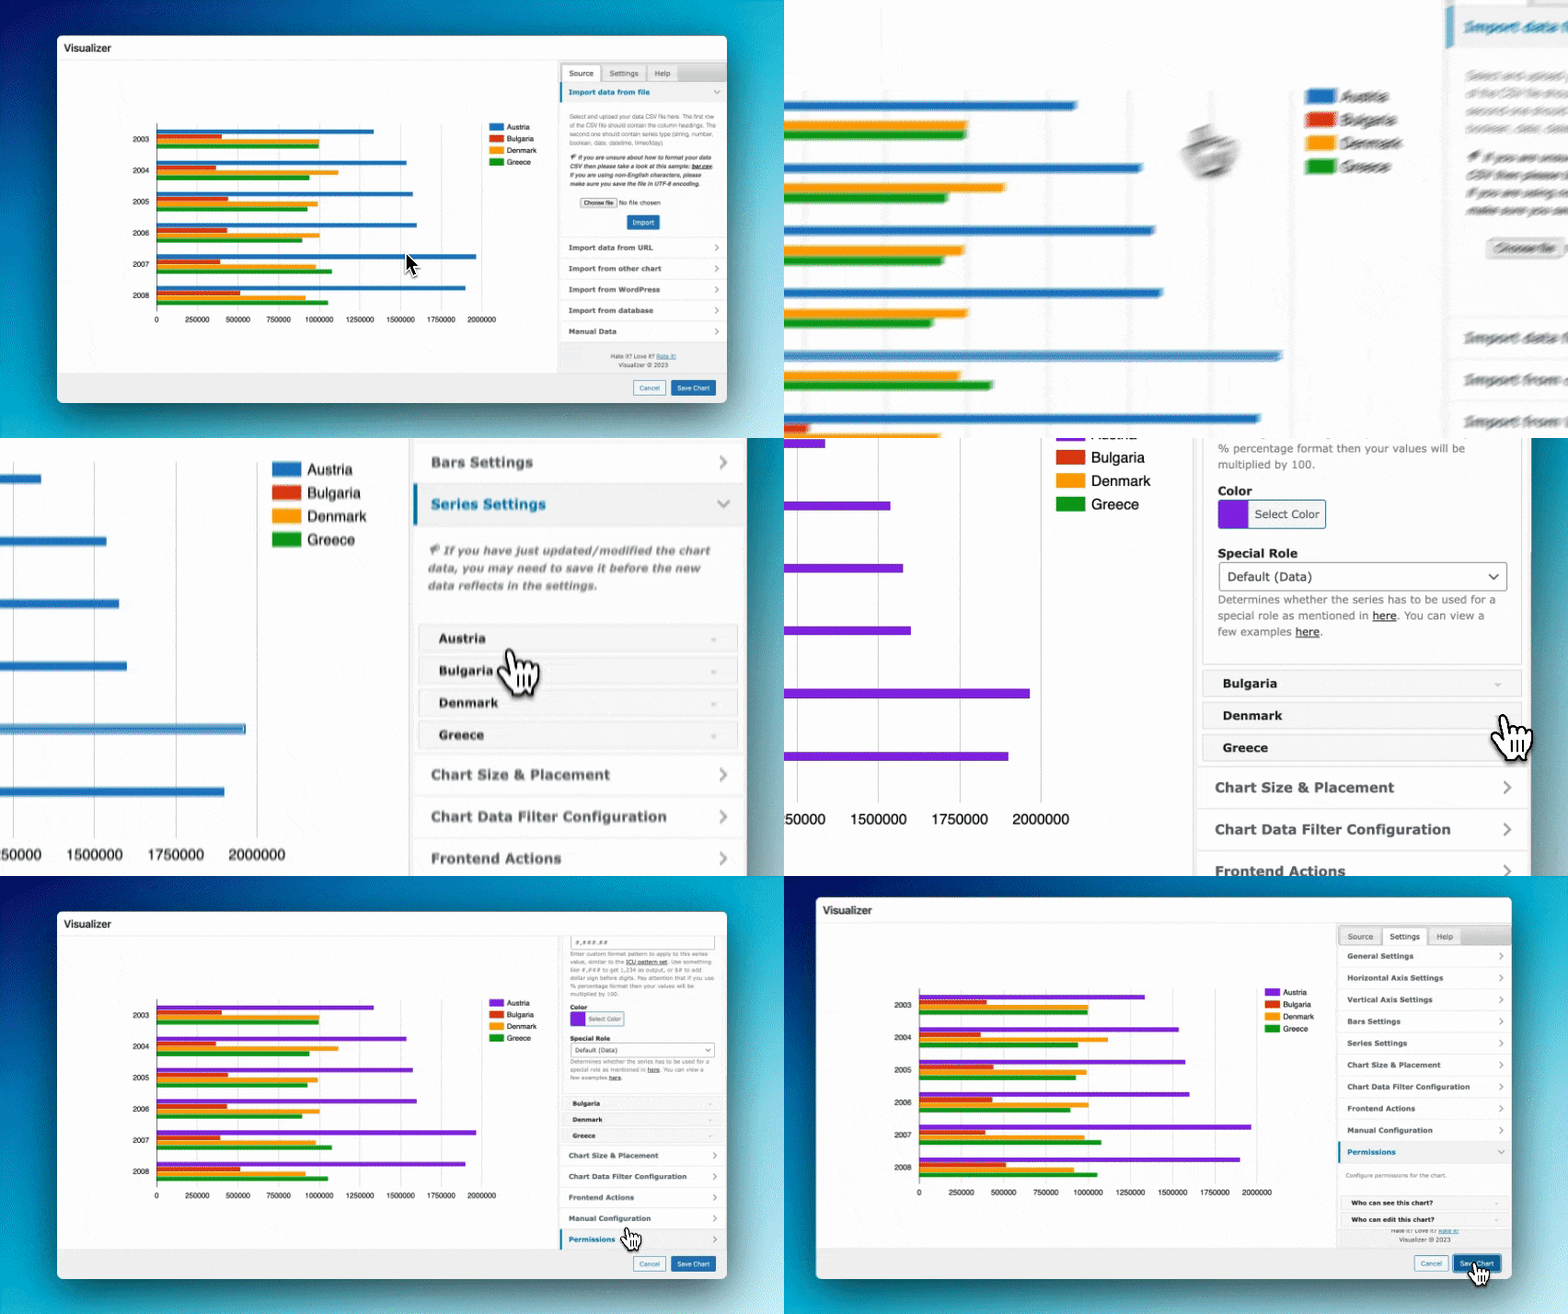
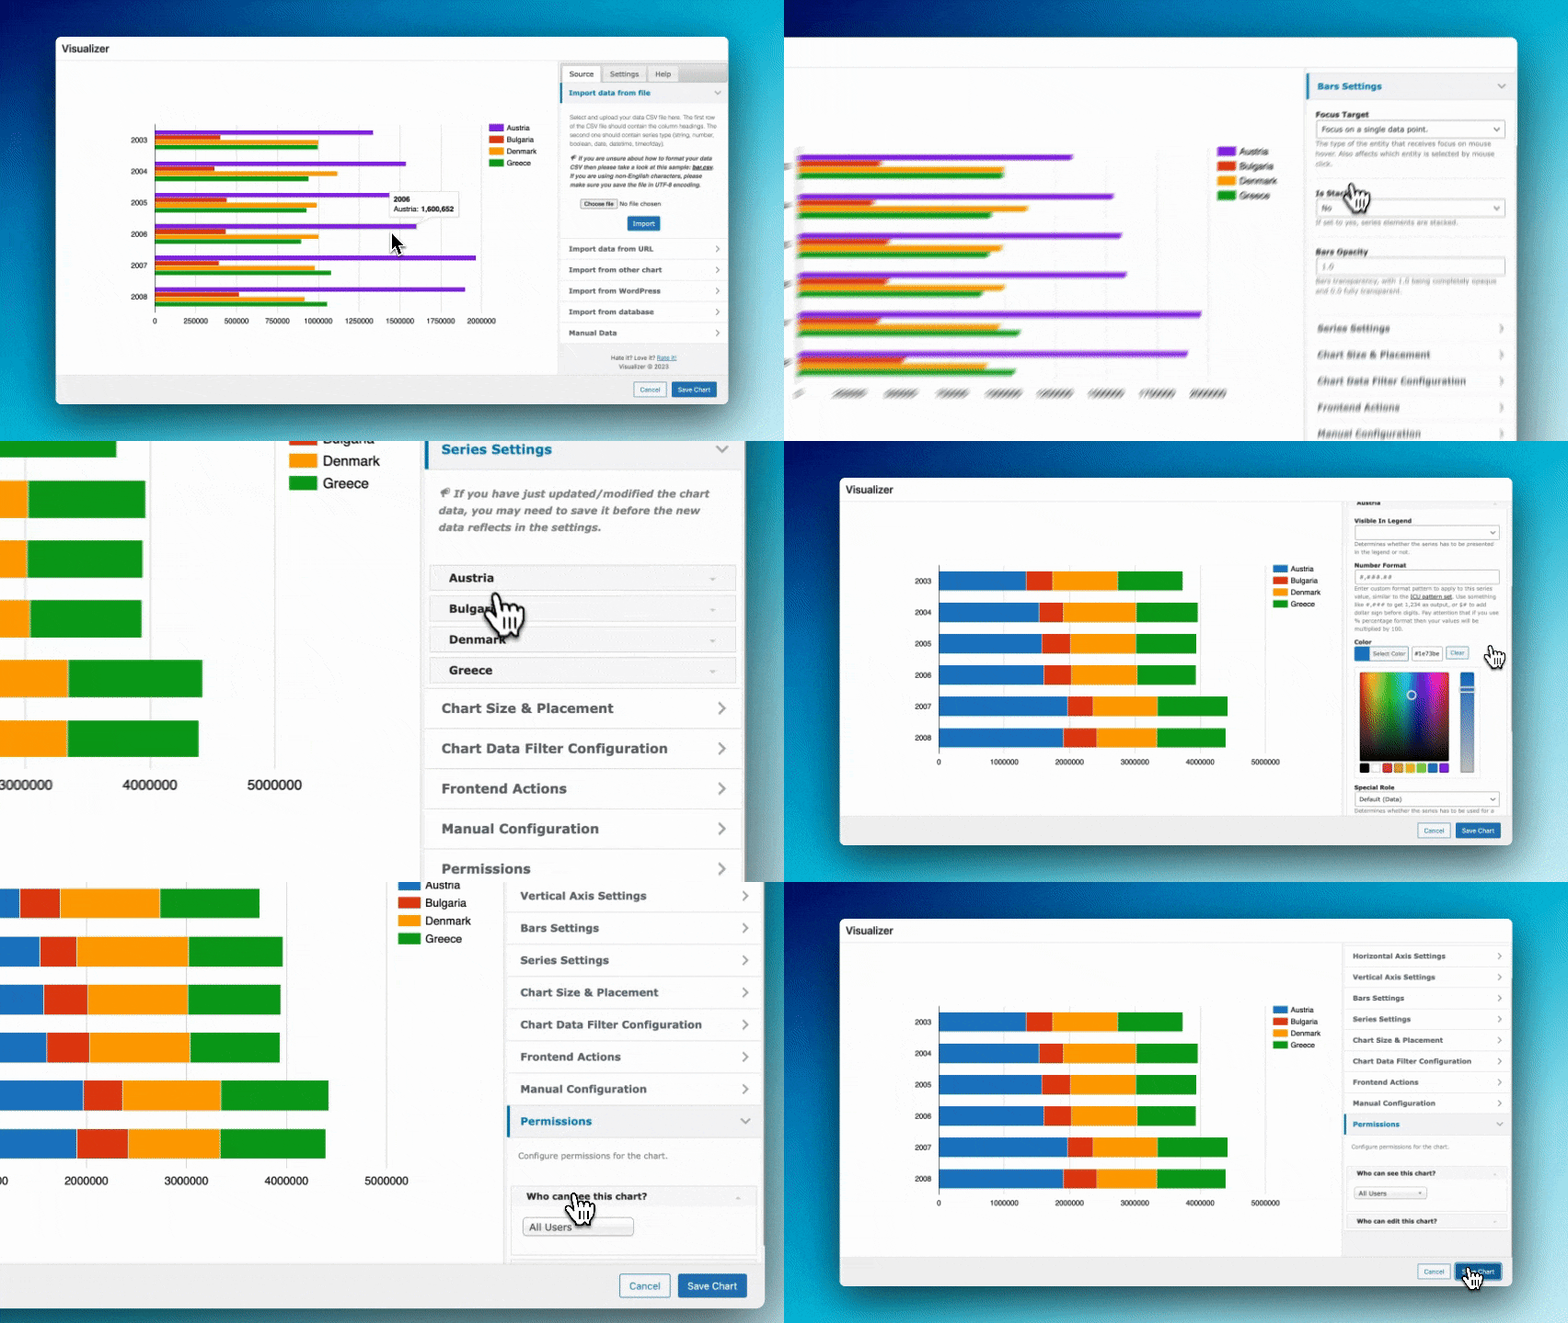
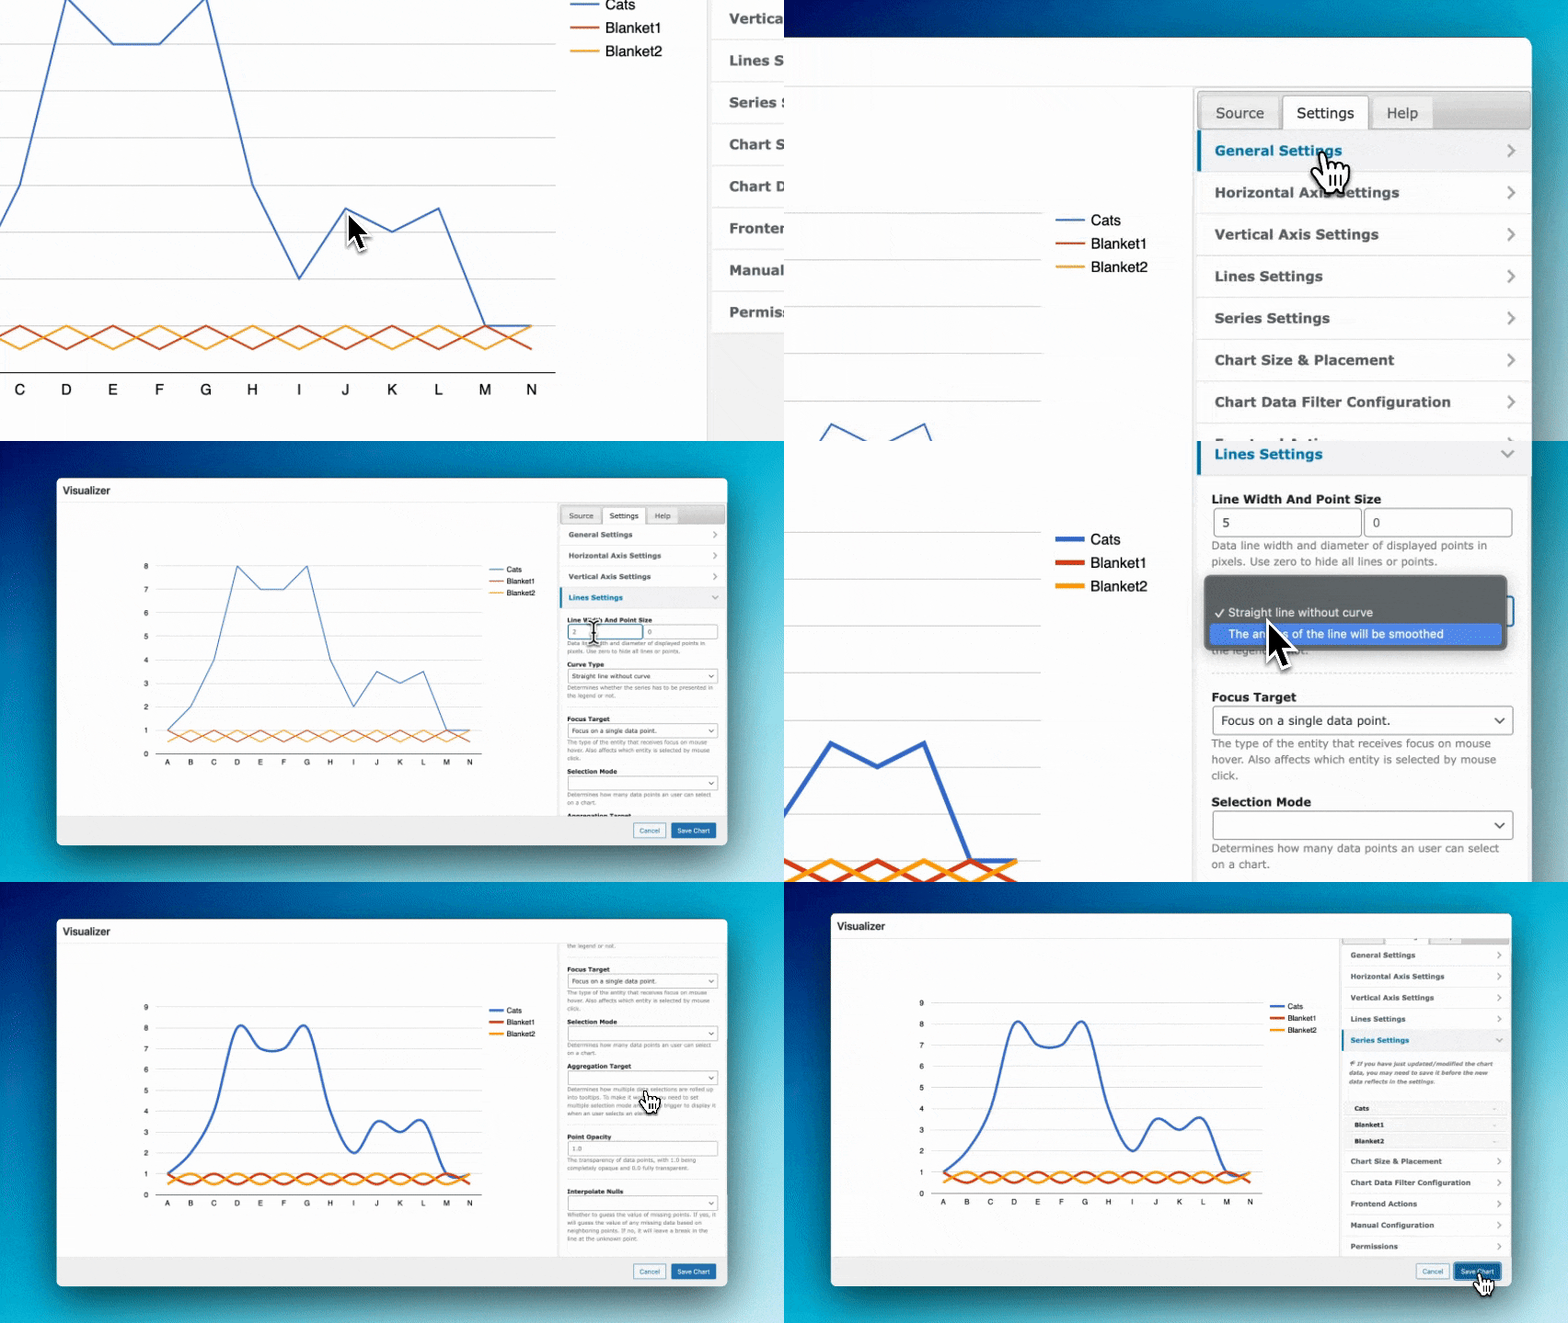
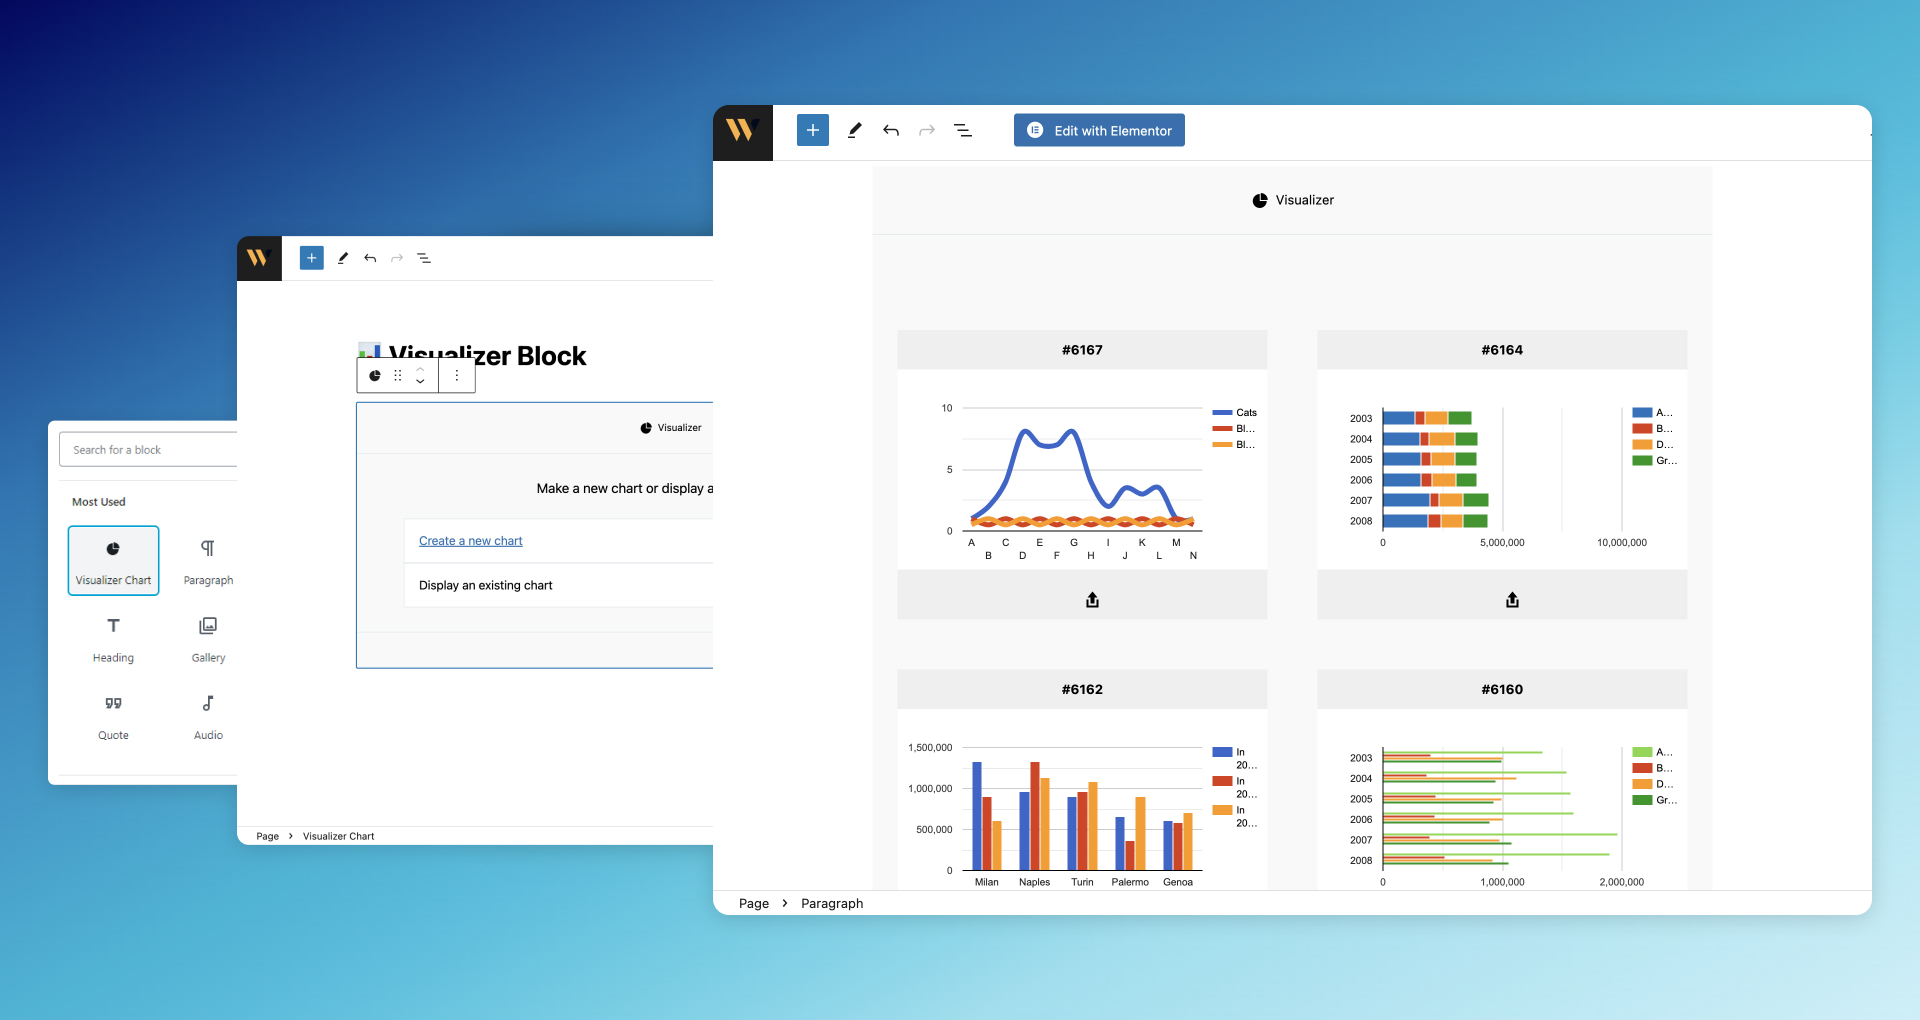
For developers
Is this your plugin? Show off the numbers.
Add a live badge to your site, docs or GitHub README. It updates on its own — no account needed.
FAQ
Visualizer: quick answers
Straight answers, pulled from live WordPress.org data.
Live data from WordPress.org · checked Sep 26, 2026
Is Visualizer free?
Yes. Visualizer is free to download and use from the official WordPress.org plugin directory.
Is Visualizer safe to use in 2026?
Yes — Visualizer is a safe, well-maintained plugin to use in 2026. It runs on 20K+ sites, is rated 4.4/5 and was last updated 2 weeks ago, and scores 91/100 on our health check.
How many websites use Visualizer?
Visualizer is active on 20K+ WordPress websites and has been downloaded 2,082,160 times since it launched in July 2013. It was downloaded 15,958 times in the last 30 days.
Does Visualizer work with WordPress 7.1?
Yes. The developer has tested Visualizer up to WordPress 7.1.2, the latest release. It requires WordPress 5.2 or newer.
What PHP version does Visualizer need?
Visualizer requires PHP 7.4 or higher. Most hosts run PHP 8.x today, so it works on any modern WordPress hosting.
When was Visualizer last updated?
The latest version, 4.0.8, was released on September 11, 2026 (2 weeks ago).
Who makes Visualizer?
Visualizer is developed and maintained by Themeisle.
Powered by PageForge
Want thousands of pages that rank like these? Build them in an afternoon.
This directory runs on the same engine as PageForge. Turn any spreadsheet, CSV or API into thousands of fast, SEO-ready WordPress pages — with schema, internal links and AI-written copy baked in.
- CSV, Google Sheets & API data sources
- AI content, schema & internal links per page
- Works with Elementor, Gutenberg, Yoast & Rank Math
- Free on WordPress.org — no credit card