


Debug Log Manager Tool
Read, search, and clear WordPress debug logs from wp-admin. Toggle WP_DEBUG and inspect errors without FTP.

Solid choice
Debug Log Manager Tool is a solid plugin choice in 2026, with a few things worth checking first. It runs on 3K+ sites, is rated 5/5 and was last updated 3 months ago, and scores 77/100 on our health check.
- Loved by users — 5/5 from 22 reviews
How does it stack up?
Side-by-side on installs, updates, ratings & support



Daily downloads
Download spikes usually follow a new release — each site that auto-updates counts as a download.
Rankings
Where Debug Log Manager Tool stands todayWordPress.org search rankings
Live position in the plugin search, top 100| Keyword | Position |
|---|---|
| Debug log | #2 |
| debugging | #17 |
| error log | #10 |
| log viewer | #4 |
| WP_DEBUG | #3 |
Version adoption
Share of active sites per release.
Rating breakdown
★★★★★★★★★★ 5 from 22 reviews
About Debug Log Manager Tool
From the official readme · v3.0.7Description
Debug Log Manager Tool is a debug log viewer and WP_DEBUG manager for WordPress. Read, search, group, and clear wp-content/debug.log from inside wp-admin; toggle WP_DEBUG, WP_DEBUG_LOG, WP_DEBUG_DISPLAY, SCRIPT_DEBUG, and SAVEQUERIES from explicit UI controls instead of editing wp-config.php; capture the last fatal error during shutdown; and review slow database queries with their stack trace. Useful as a lightweight alternative to Query Monitor or Debug Bar when you mainly need a clean debug.log reader and explicit debug-constant control.
The plugin focuses on safe first-run behavior: activation does not automatically turn debug mode on, deactivation does not automatically turn it off, and existing debug constants or custom log paths are preserved until you choose to change them.
Use it to inspect the current debug log, search and group log entries, copy useful error details, and make explicit debug configuration changes from the WordPress admin when needed. Advanced tools such as terminal commands, database inspection, Safe Mode, and notifications are available as optional helpers.
Quick Demo
Key Features
- Safe First Run: Activating the plugin does not automatically change WP_DEBUG, WP_DEBUG_LOG, WP_DEBUG_DISPLAY, SCRIPT_DEBUG, SAVEQUERIES, or existing log paths.
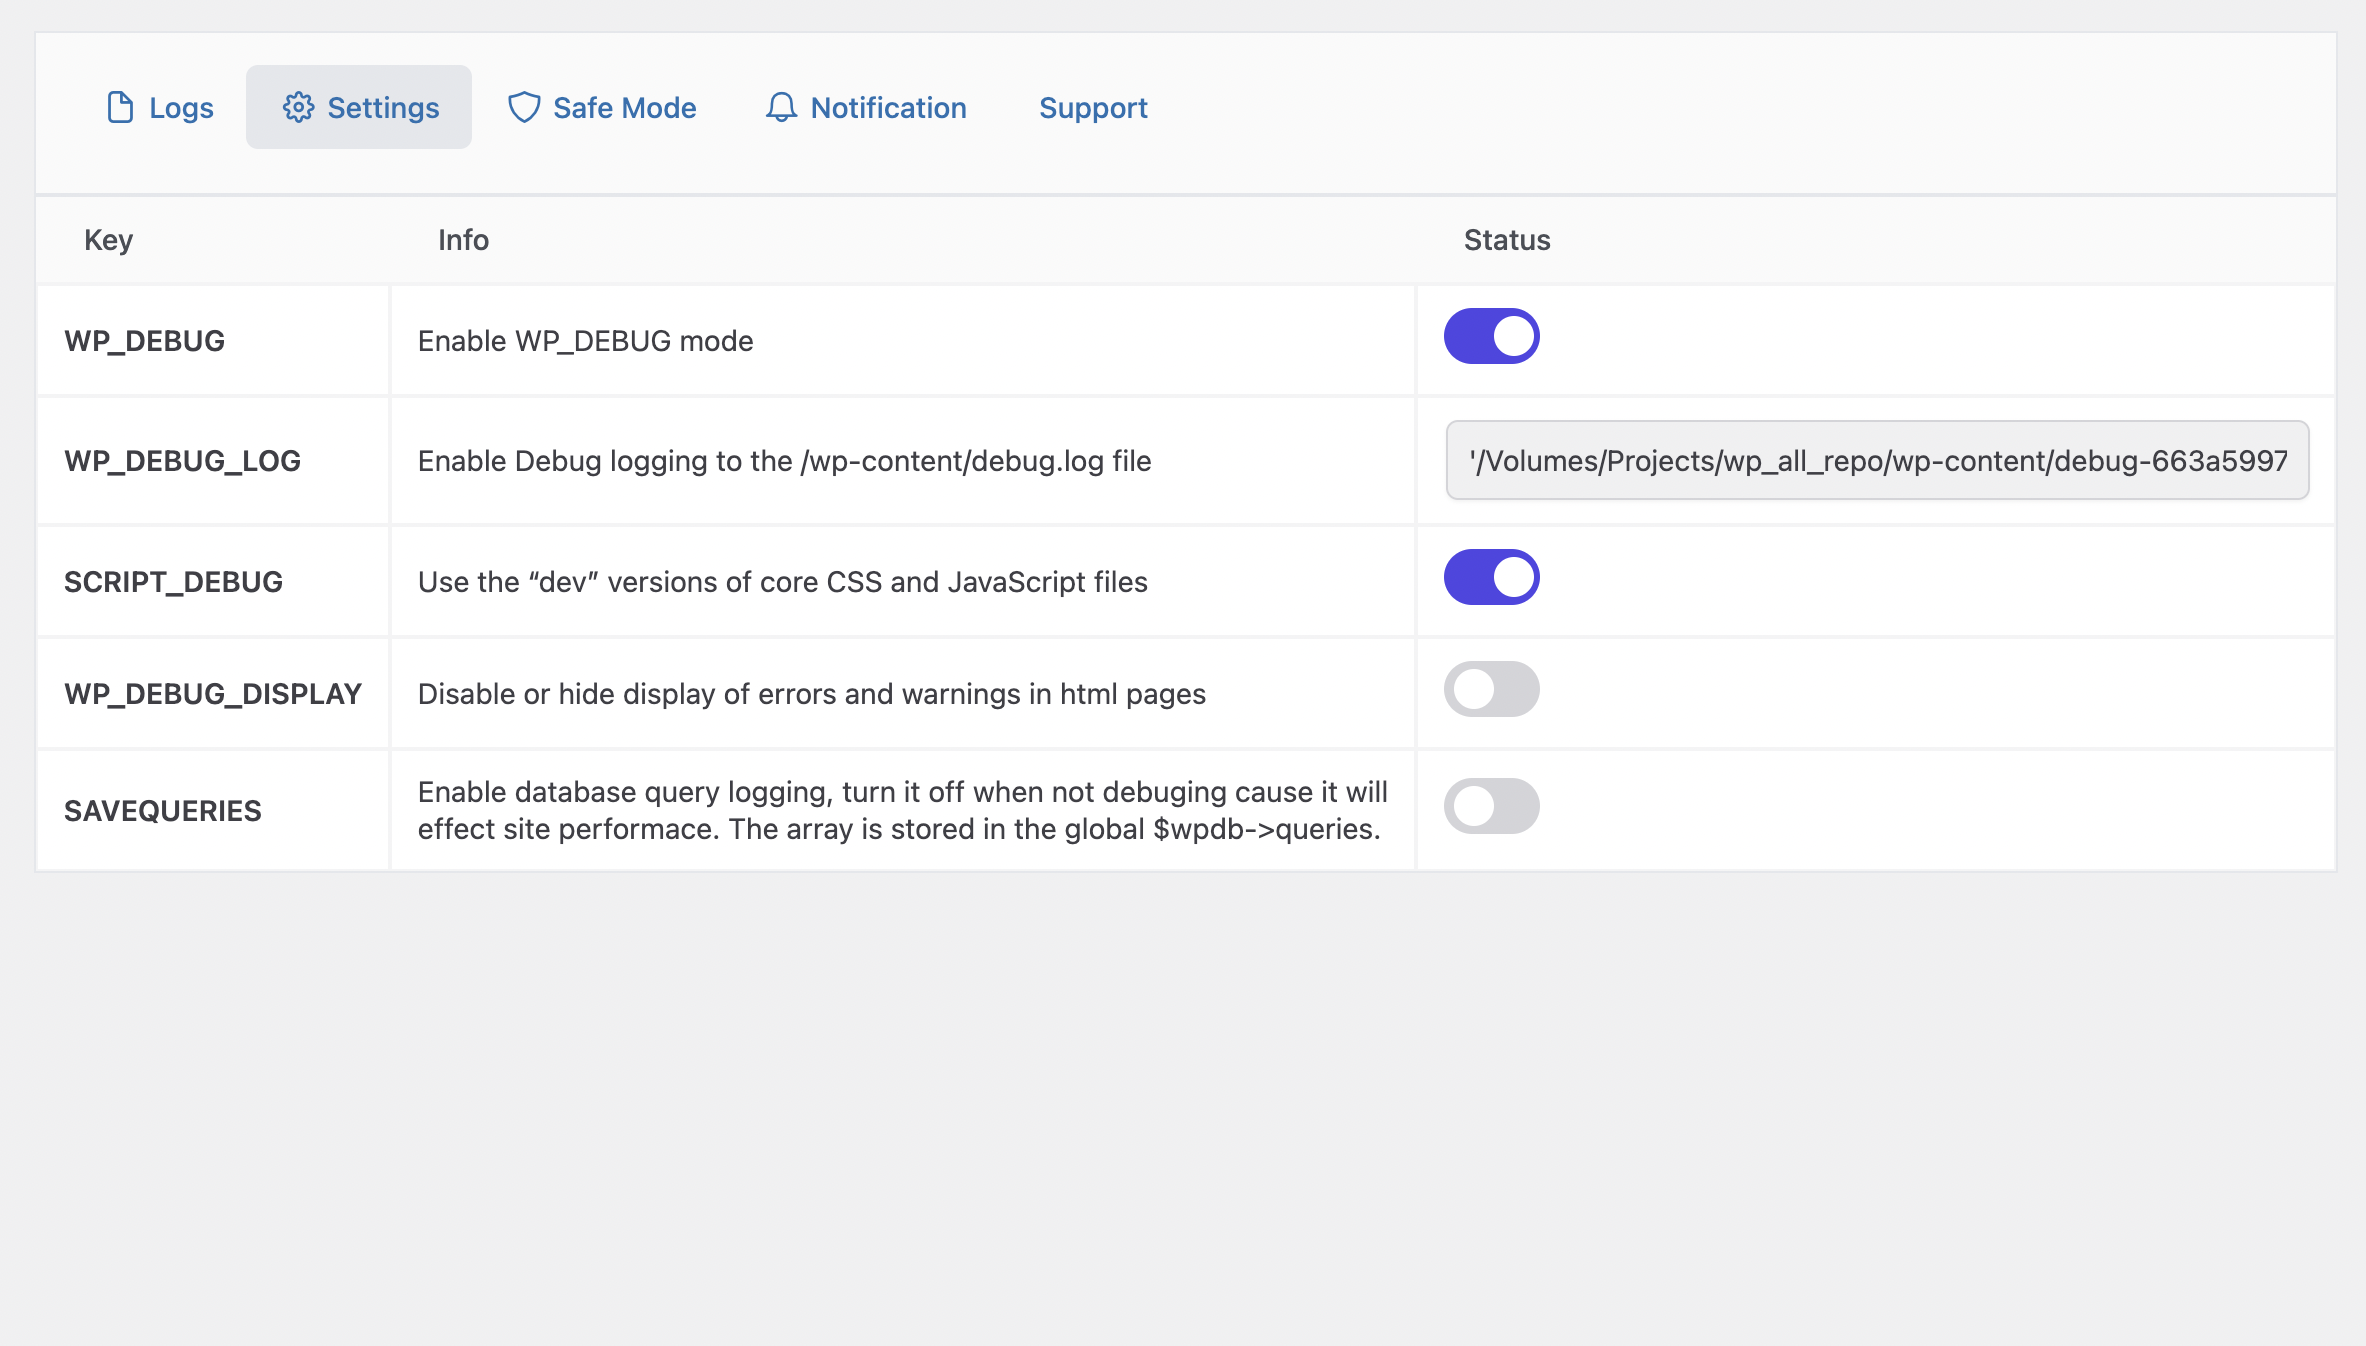
- Explicit Debug Controls: Review current debug constant values and update them only through intentional UI actions.
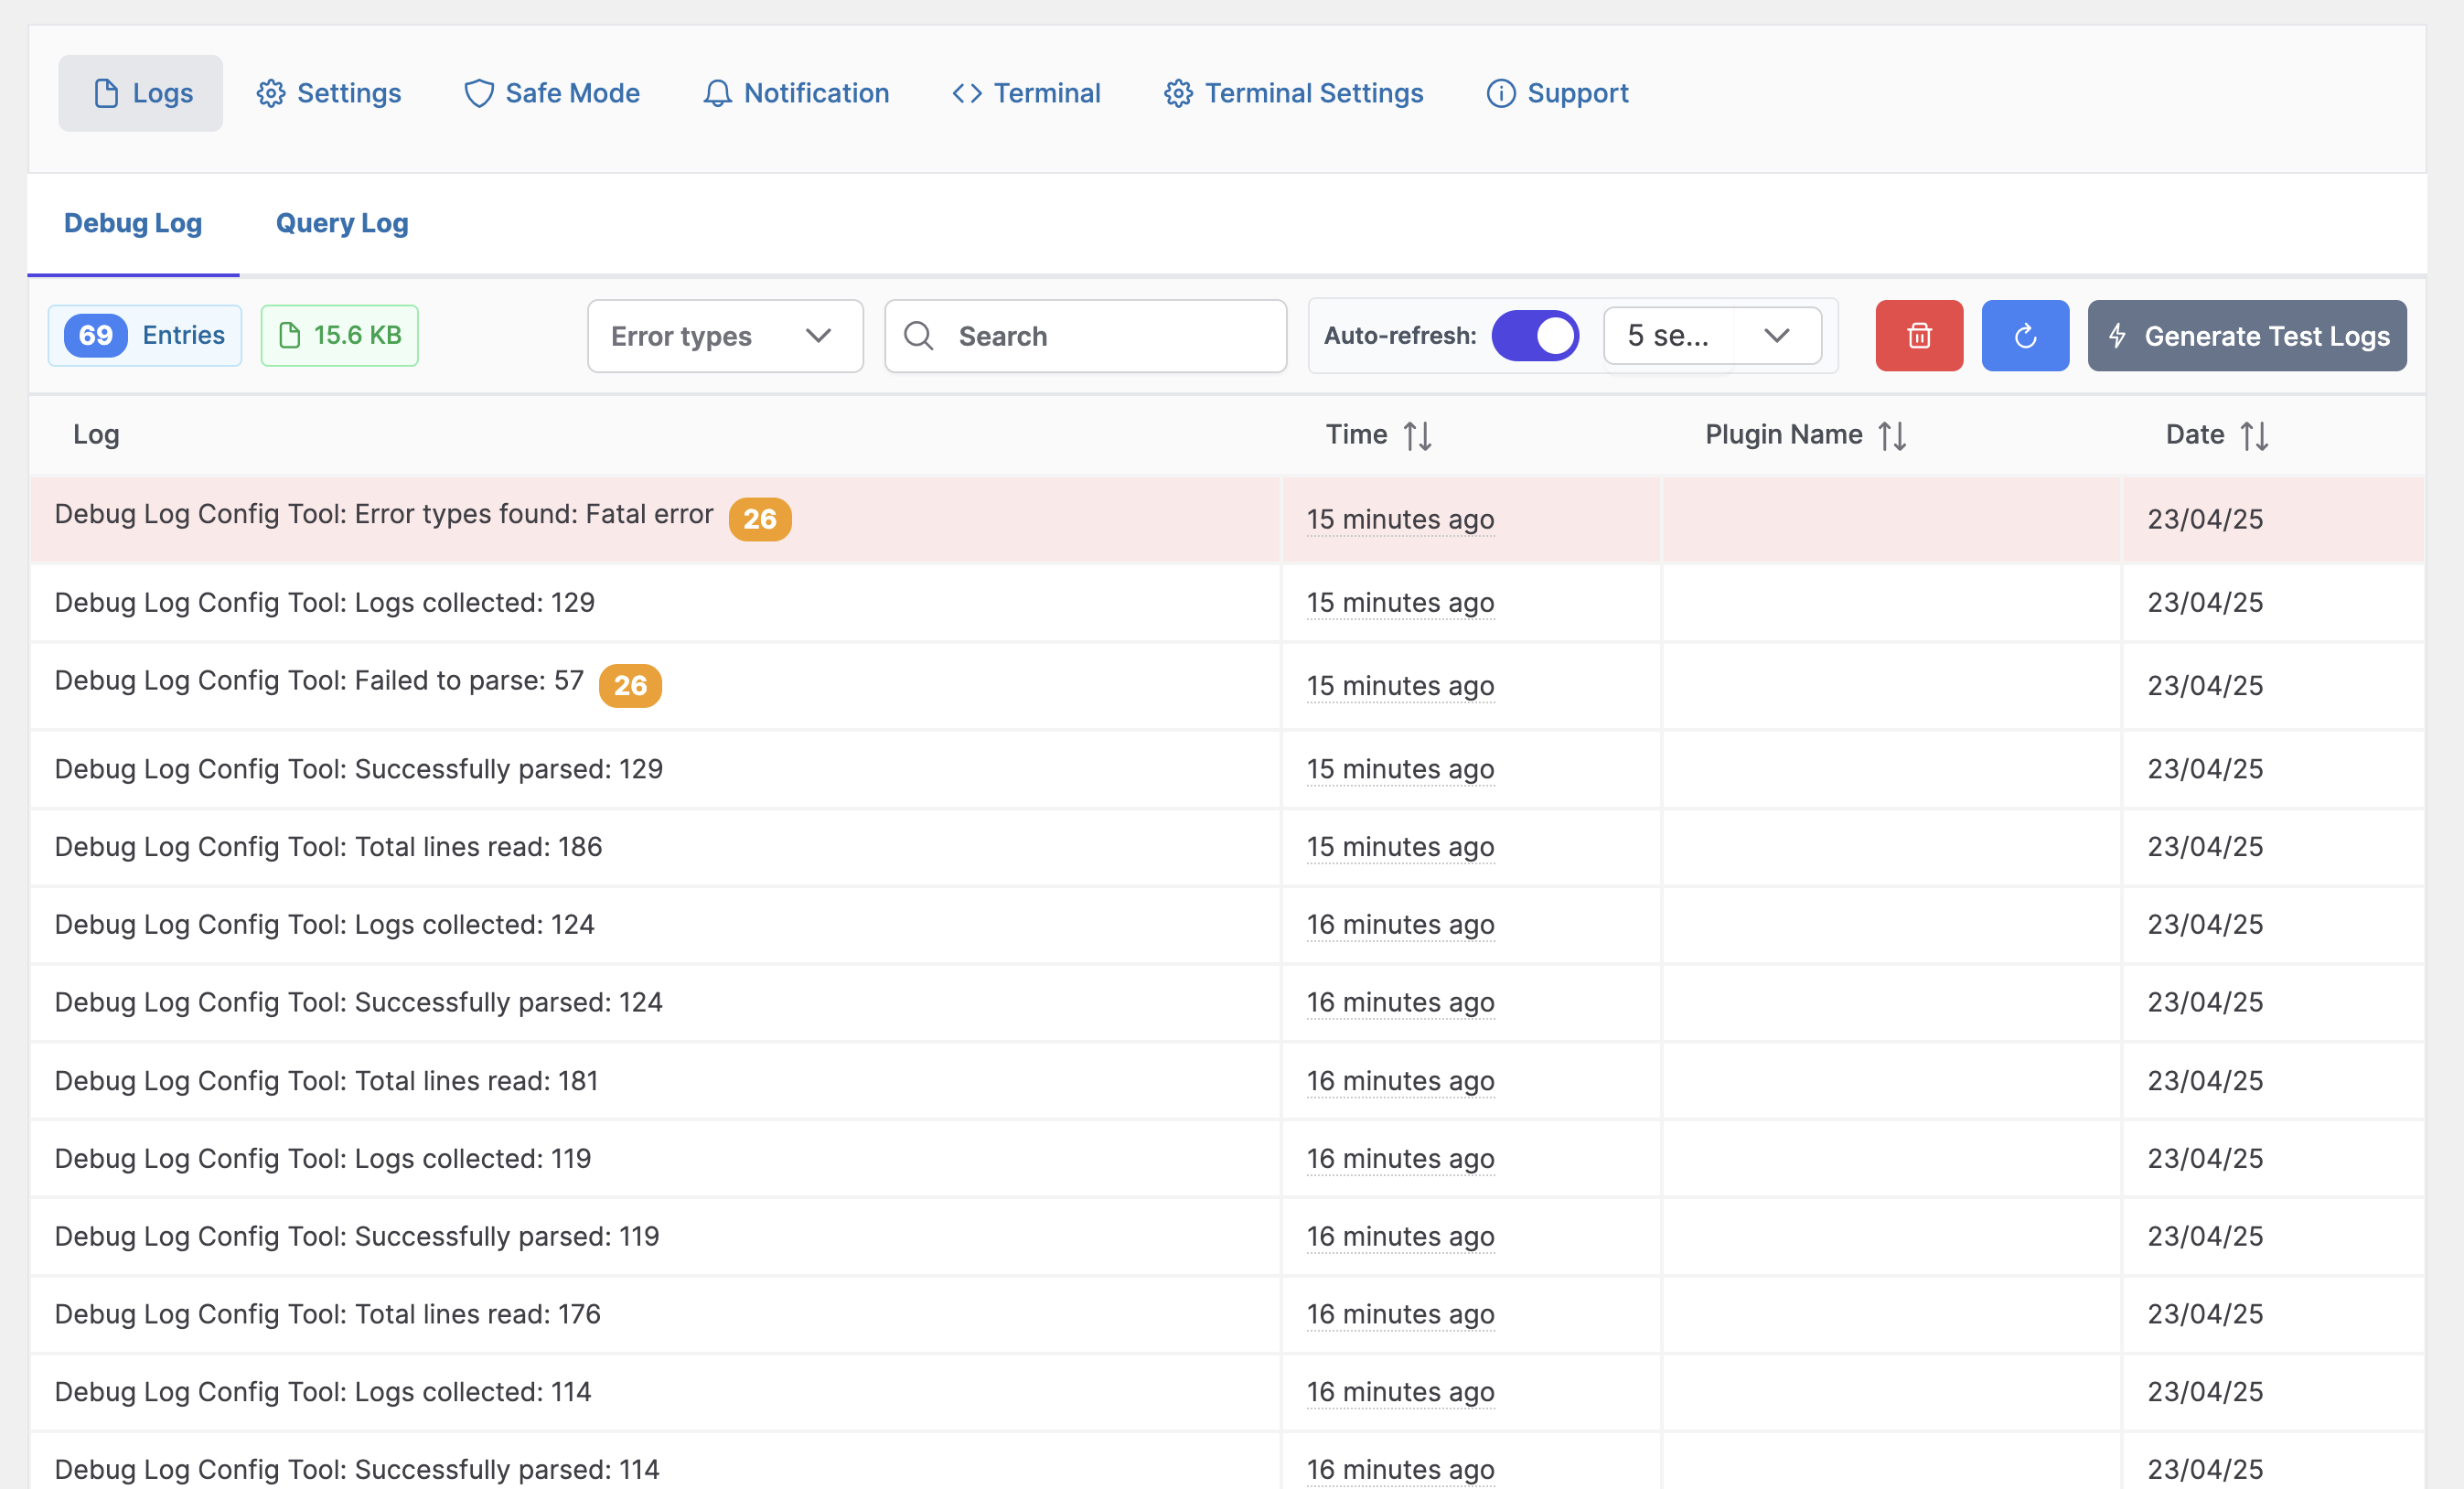
- Modern Debug Log Viewer: View, search, filter, group, copy, and clear debug log entries from a compact WordPress admin interface.
- Readable Timeline Rows: Scan log entries with severity labels, occurrence counts, plugin/source hints, exact timestamps, and copy-as-JSON actions.
- Stack Trace Analysis: Format PHP stack traces and database call chains so long fatal errors are easier to read.
- Last Fatal Snapshot: Capture the latest fatal error during shutdown and show it in the log screen when wp-admin is available again.
- Large Log File Preview: Open the current debug log file inside a modal and safely read the latest 1 MB of large files.
- Smooth Upgrade Behavior: Upgrades preserve existing constants and custom debug log locations instead of replacing your current configuration.
- Query Inspector: Optionally examine database queries when SAVEQUERIES is enabled, including SQL, caller, execution time, and stack trace details.
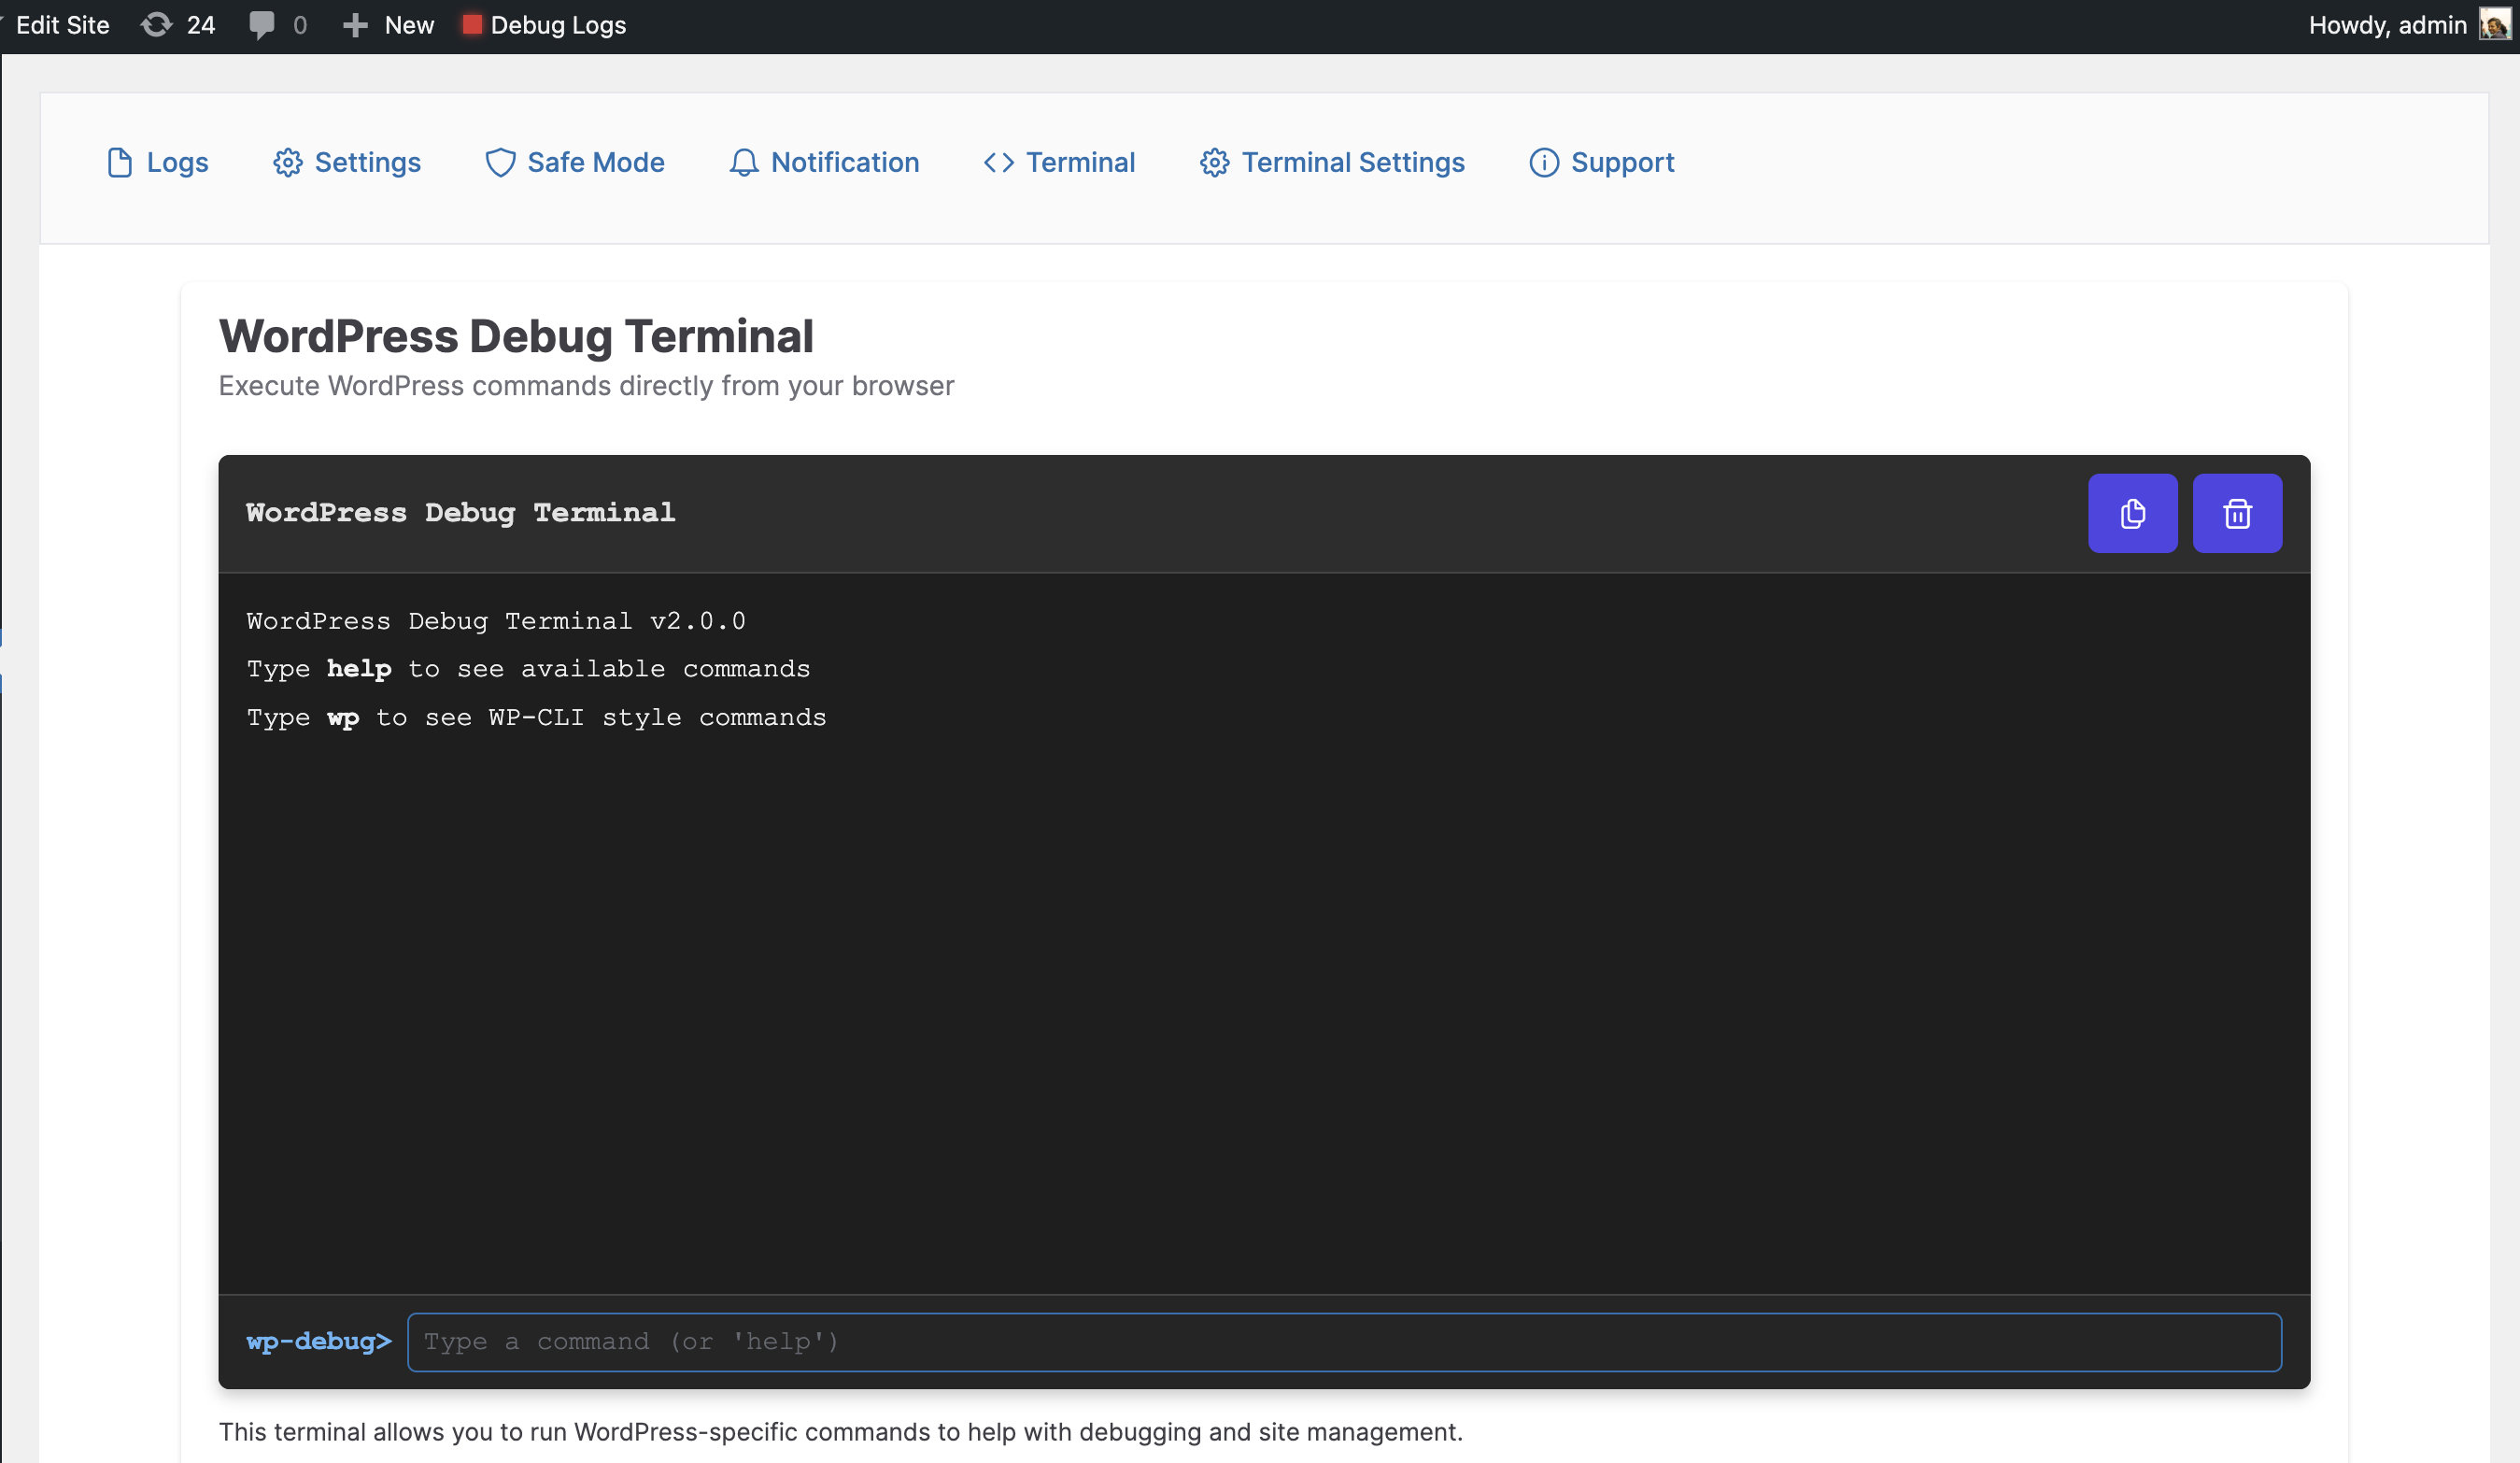
- WP-CLI Style Terminal: Optionally run guarded WordPress-style commands directly from the browser with command history and auto-completion.
- Terminal Settings: Enable or disable terminal access and database commands from a dedicated settings screen.
- Safe Mode: Optionally isolate plugin conflicts by keeping selected plugins active and restoring the previous state when Safe Mode is turned off.
- Email Notifications: Optionally configure notification email settings, daily summaries, and test email delivery for debug activity.
- Admin Bar Debug Toggle: Quickly review and change WP_DEBUG from the WordPress admin bar when you explicitly choose to.
- Dashboard Widget: See recent debug log activity from the WordPress dashboard.
- Custom Log Path Support: Keep existing custom log paths and use filters to customize the debug log location.
- Hardened Admin Routes: AJAX actions use nonce and capability checks, with guarded file path handling for debug log access.
Debug Constants Available
These constants can be reviewed and changed from the plugin UI. The plugin does not change them on activation or deactivation.
- WP_DEBUG – Enables WordPress debug mode
- WP_DEBUG_LOG – Saves errors to the configured debug log destination
- SCRIPT_DEBUG – Uses development versions of core JS and CSS files
- WP_DEBUG_DISPLAY – Controls whether debug messages display on screen
- SAVEQUERIES – Saves database queries for analysis
Developer Tools
- Terminal Commands: Optionally use WP-CLI style commands like
wp core versionorwp plugin list - Database Explorer: Optionally run SELECT queries and view results in a formatted table
- Stack Trace Analysis: Visualize error stack traces for easier debugging
- Hook Inspector: View all registered hooks and their callbacks
- Environment Detection: Development features are automatically hidden in production
- Copy JSON: Copy structured log entries for support tickets or developer handoff
- File Viewer: Inspect the debug log file without leaving the WordPress admin screen
Developer API: Use filters like
wp_dlct_log_file_pathanddlct_debug_file_pathto customize log path behavior.
Please note: Configuration changes are made only by explicit UI actions. Deactivating the plugin does not automatically restore, remove, enable, or disable WordPress debug constants.
Installation
- Upload the plugin files to the
/wp-content/plugins/debug-log-config-tooldirectory, or install the plugin through the WordPress plugins screen directly. - Activate the plugin through the ‘Plugins’ screen in WordPress. Activation will not automatically change your debug constants.
- Go to Tools -> Debug Logs to view logs, review current debug settings, or make an explicit configuration change.
Frequently asked questions
Do I need file manager/FTP or modify wp-config.php?
No. You can review current debug settings and turn debug constants on or off from the plugin settings when you choose to. Activation itself does not edit your debug configuration.
Will activation or deactivation change my debug constants?
No. Activation and deactivation do not automatically change WP_DEBUG, WP_DEBUG_LOG, WP_DEBUG_DISPLAY, SCRIPT_DEBUG, SAVEQUERIES, or your configured debug log path.
What happens when I upgrade from an older version?
The plugin preserves your existing debug constants and log path. Upgrade handling is designed to avoid replacing your current configuration unless you make an explicit change in the UI.
Are terminal commands and database tools required?
No. The core value is log viewing and debug configuration management. Terminal, database, Safe Mode, and notification tools are optional advanced features.
Can it help after a fatal error?
Yes. The plugin stores a small last-fatal-error snapshot during WordPress shutdown and shows it in the log screen when the dashboard can load again. It does not create a public emergency log viewer.
Can I see full debug in dashboard?
Yes you can see a simple log in dashboard widget and nicely formatted view in the plugin
What does safe mode do?
Safe mode will deactivate all the plugin except the selected one. When you turn safe mode off it will restore all the previous activated plugin.
Changelog
3.0.7
- New: Emergency Log Viewer — an optional, password-protected page that lets you read the debug log even when the site is down with a fatal error and wp-admin is unreachable. Enable it and set credentials under Settings, then bookmark the URL.
- Fixed: log timestamps are now shown in your own (browser) timezone, and the relative “x minutes ago” label always matches the exact-time tooltip.
- Fixed: historical log entries written in the standard WordPress format no longer show today’s date; the original date and time are preserved.
- Improved: success and confirmation messages now stay on screen long enough to read.
3.0.6
- Fixed: AJAX requests for removed or unknown actions no longer surface as a critical PHP error in wp-admin. The router now returns a JSON 404 and logs the attempt instead of throwing an uncaught exception.
- Fixed: admin-bar debug toggle script and styles are no longer injected on admin screens where the toggle is not rendered (AJAX, REST, cron, network admin, or for users without the required capability), resolving Vue 2 conflicts on JetEngine and Crocoblock editor screens.
- Improved: WP.org readme metadata — bumped Tested up to 7.0, Requires at least 6.0, Requires PHP 7.4, and refreshed tags and description copy for clearer search discoverability.
- Improved: synced plugin header (Requires at least, Requires PHP, Tested up to) so the in-WordPress plugin updater agrees with the readme.
3.0.5
- Added last fatal error snapshots so the log screen can show the most recent fatal captured during shutdown.
- Added read-only terminal commands for inspecting options, posts, users, and metadata without arbitrary PHP execution.
- Improved Query Log so missing or unchanged debug log files no longer hide collected database queries.
- Improved Query Log sorting and labels to show the most expensive queries first with execution time, duplicate count, and duplicate total time.
- Hardened first-run and upgrade behavior so activation, deactivation, settings reads, and log reads do not silently change debug constants or create a new debug log path.
- Defaulted terminal access to disabled for fresh installs while preserving saved terminal settings.
- Refreshed README and WordPress.org copy around safe first-run log management and optional advanced tools.
3.0.4
- Refreshed the plugin directory banner and icon with a softer visual style.
3.0.3
- Refreshed plugin directory assets and feature documentation.
3.0.2
- Improved debug log time labels so older entries show exact dates instead of misleading relative age text.
- Normalized the plugin name spelling on public plugin metadata.
Screenshots
For developers
Is this your plugin? Show off the numbers.
Add a live badge to your site, docs or GitHub README. It updates on its own — no account needed.
Best Debug Log Manager Tool alternatives
All Debug log plugins →





FAQ
Debug Log Manager Tool: quick answers
Straight answers, pulled from live WordPress.org data.
Live data from WordPress.org · checked Sep 26, 2026
Is Debug Log Manager Tool free?
Yes. Debug Log Manager Tool is free to download and use from the official WordPress.org plugin directory.
Is Debug Log Manager Tool safe to use in 2026?
Debug Log Manager Tool is a solid plugin choice in 2026, with a few things worth checking first. It runs on 3K+ sites, is rated 5/5 and was last updated 3 months ago, and scores 77/100 on our health check.
How many websites use Debug Log Manager Tool?
Debug Log Manager Tool is active on 3K+ WordPress websites and has been downloaded 72,915 times since it launched in August 2021. It was downloaded 1,083 times in the last 30 days.
Does Debug Log Manager Tool work with WordPress 7.1?
Debug Log Manager Tool is officially tested up to WordPress 7.0.6, while the latest release is 7.1.2. It may still work, but try it on a staging site first.
What PHP version does Debug Log Manager Tool need?
Debug Log Manager Tool requires PHP 7.4 or higher. Most hosts run PHP 8.x today, so it works on any modern WordPress hosting.
When was Debug Log Manager Tool last updated?
The latest version, 3.0.7, was released on June 23, 2026 (3 months ago).
Who makes Debug Log Manager Tool?
Debug Log Manager Tool is developed and maintained by Lukman Hussain Nakib.
What are the best alternatives to Debug Log Manager Tool?
The most popular alternatives to Debug Log Manager Tool are Conflict Finder (100+ installs), BugTrace – Debug Log Tool (50+ installs) and Clear Debug.log Cron (20+ installs).
Powered by PageForge
Want thousands of pages that rank like these? Build them in an afternoon.
This directory runs on the same engine as PageForge. Turn any spreadsheet, CSV or API into thousands of fast, SEO-ready WordPress pages — with schema, internal links and AI-written copy baked in.
- CSV, Google Sheets & API data sources
- AI content, schema & internal links per page
- Works with Elementor, Gutenberg, Yoast & Rank Math
- Free on WordPress.org — no credit card